GROWTH AND DECAY OF CORAL REEFS

Here’s a selection of illustrations, charts, and maps I created for a book by renowned marine biologist and author, Dr. Peter J. Vine. The book, Growth and Decay of Coral Reefs: Fifty Years of Learning, was published as a hardcover and an ebook by CRC Press on September 15, 2023.
It was a great honor to work with Vine, who in the 1970s, led a group of British scientists who studied Red Sea reefs off the coast of Sudan, including corals growing on Cousteau’s abandoned underwater garage. He also studied the many fish and other creatures that inhabited the reefs, and the dynamics between coral, CCA (crustose coralline algae), sponges, and macroalgae. His observations are an important part of the historical record, documenting how coral reefs flourished or declined 50 years ago compared to today.
During the COVID-19 pandemic, I worked remotely with Vine to help redraw 30 dive transects in a publishable format. I contributed maps of the region, diagrams of experiments and Cousteau’s garage, and over 50 illustrations of Red Sea fish.


Poster design
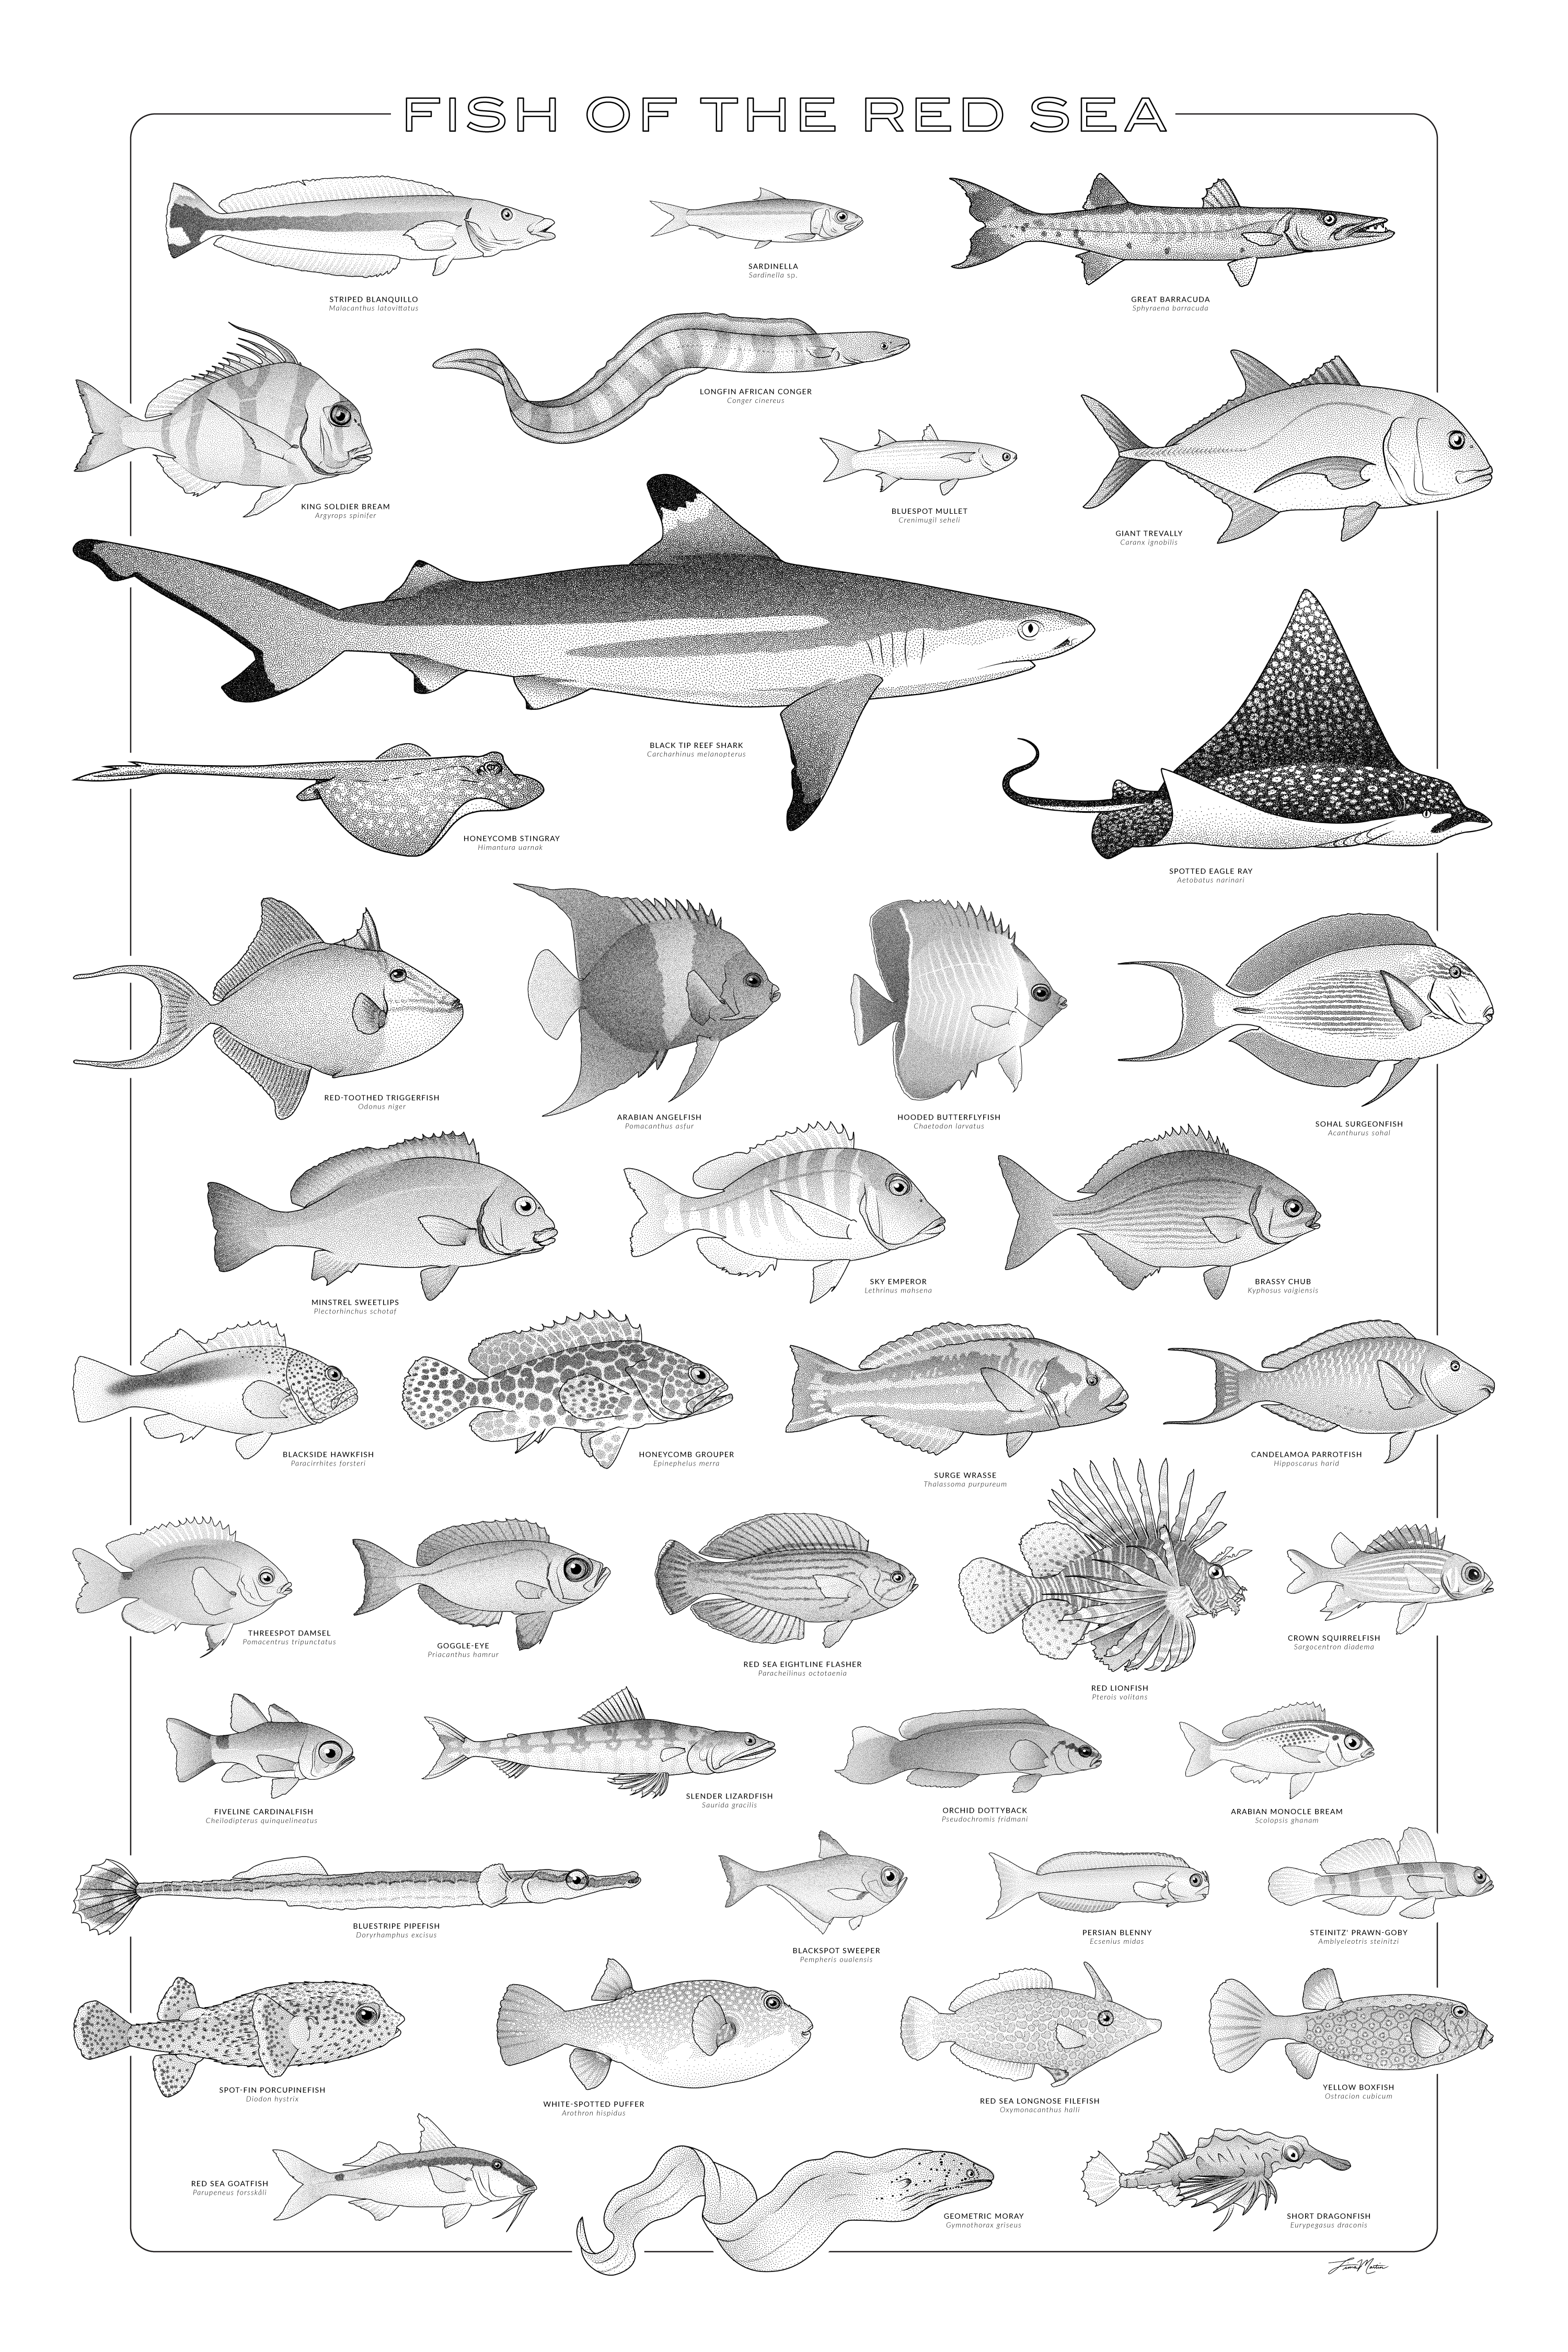
While the book was in press, I designed this minimalist poster with the black-and-white fish illustrations. It was selected to be shown in the 2023 GNSI Juried Members’ Exhibit.
Process
I’m happy to have found ways to incorporate traditional styles in digital media. The result is high-quality graphics that stand out compared to photos or more plastic-like digital illustrations.
For this book, I used Adobe Illustrator along with Astute Graphics plugins. While my style appears similar to traditional pen-and-ink and watercolor, it is actually composed of scalable vector paths and editable layers.

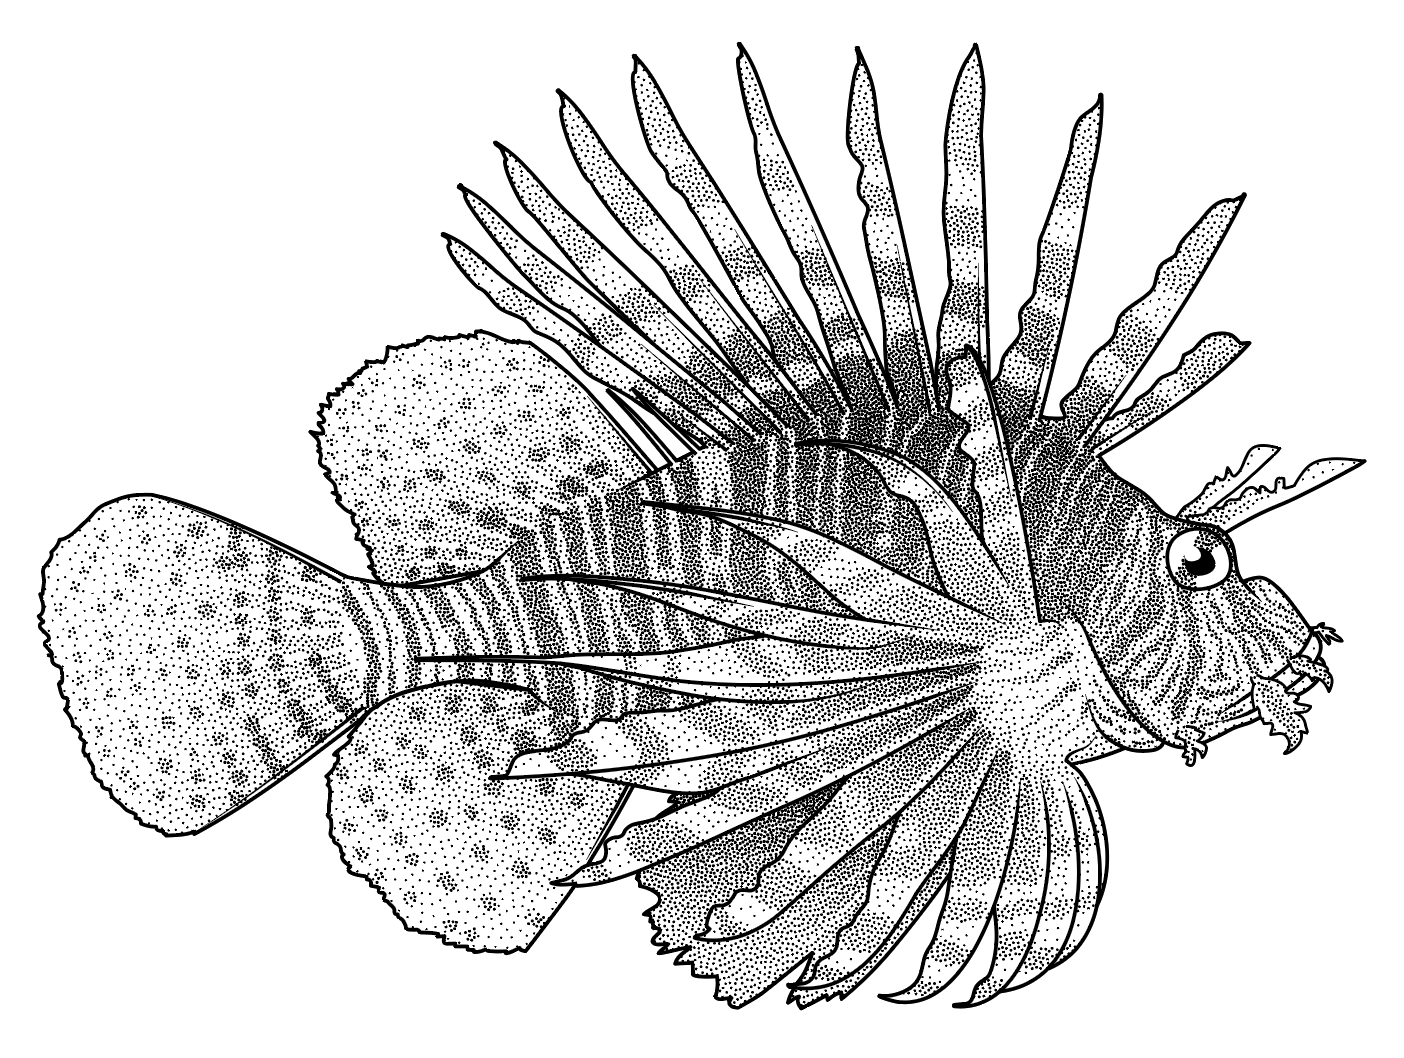
I was able to render each fish in about 4 steps. (1) Referring to a combination of reference images, I drew the lines with Illustrator’s pen tool, varying stroke widths or adding tapered ends as needed. (2) On a separate layer, I added shading in grayscale to show planes or curves, fin rays, and patterns. (3) Next, using the Astute Graphics’ Stipplism plugin, I transformed the grayscale fills/gradients into stippled dots. (4) Finally, I adjusted the dot density as needed.


