Discover how the geology of the Columbia River Basin was formed first by lava floods and then by ice age floods—in illustrations! View the interactive scrolling story and the print replica published on C1 on Sunday, June 29th, 2025, in The Seattle Times.
Visual journalist Fiona Martin directed the story’s development from start to finish, including writing (with Lynda Mapes), print design, 17 illustrations, 7 maps, and a chart.
Some of these graphics were featured in a Sunday A1 story titled “How we pushed the Columbia, the great river of the West, to its limit,” written by Lynda Mapes. Photographer Erika Schultz and Videographer Lauren Frohne also contributed.
Tap on any thumbnail below to view a larger version.
Process
The geology illustrations were inspired by an interview with YouTube personality, “Nick on the Rocks.” Nick Zenter, a geology professor at Central Washington University, is the kind of teacher we all wish we could have—and a great storyteller. For one, he loves using food metaphors—which made the geology concepts more relatable—and stirred an appetite for Lynda’s roadtrip snacks (avocado sandwiches, anyone?).
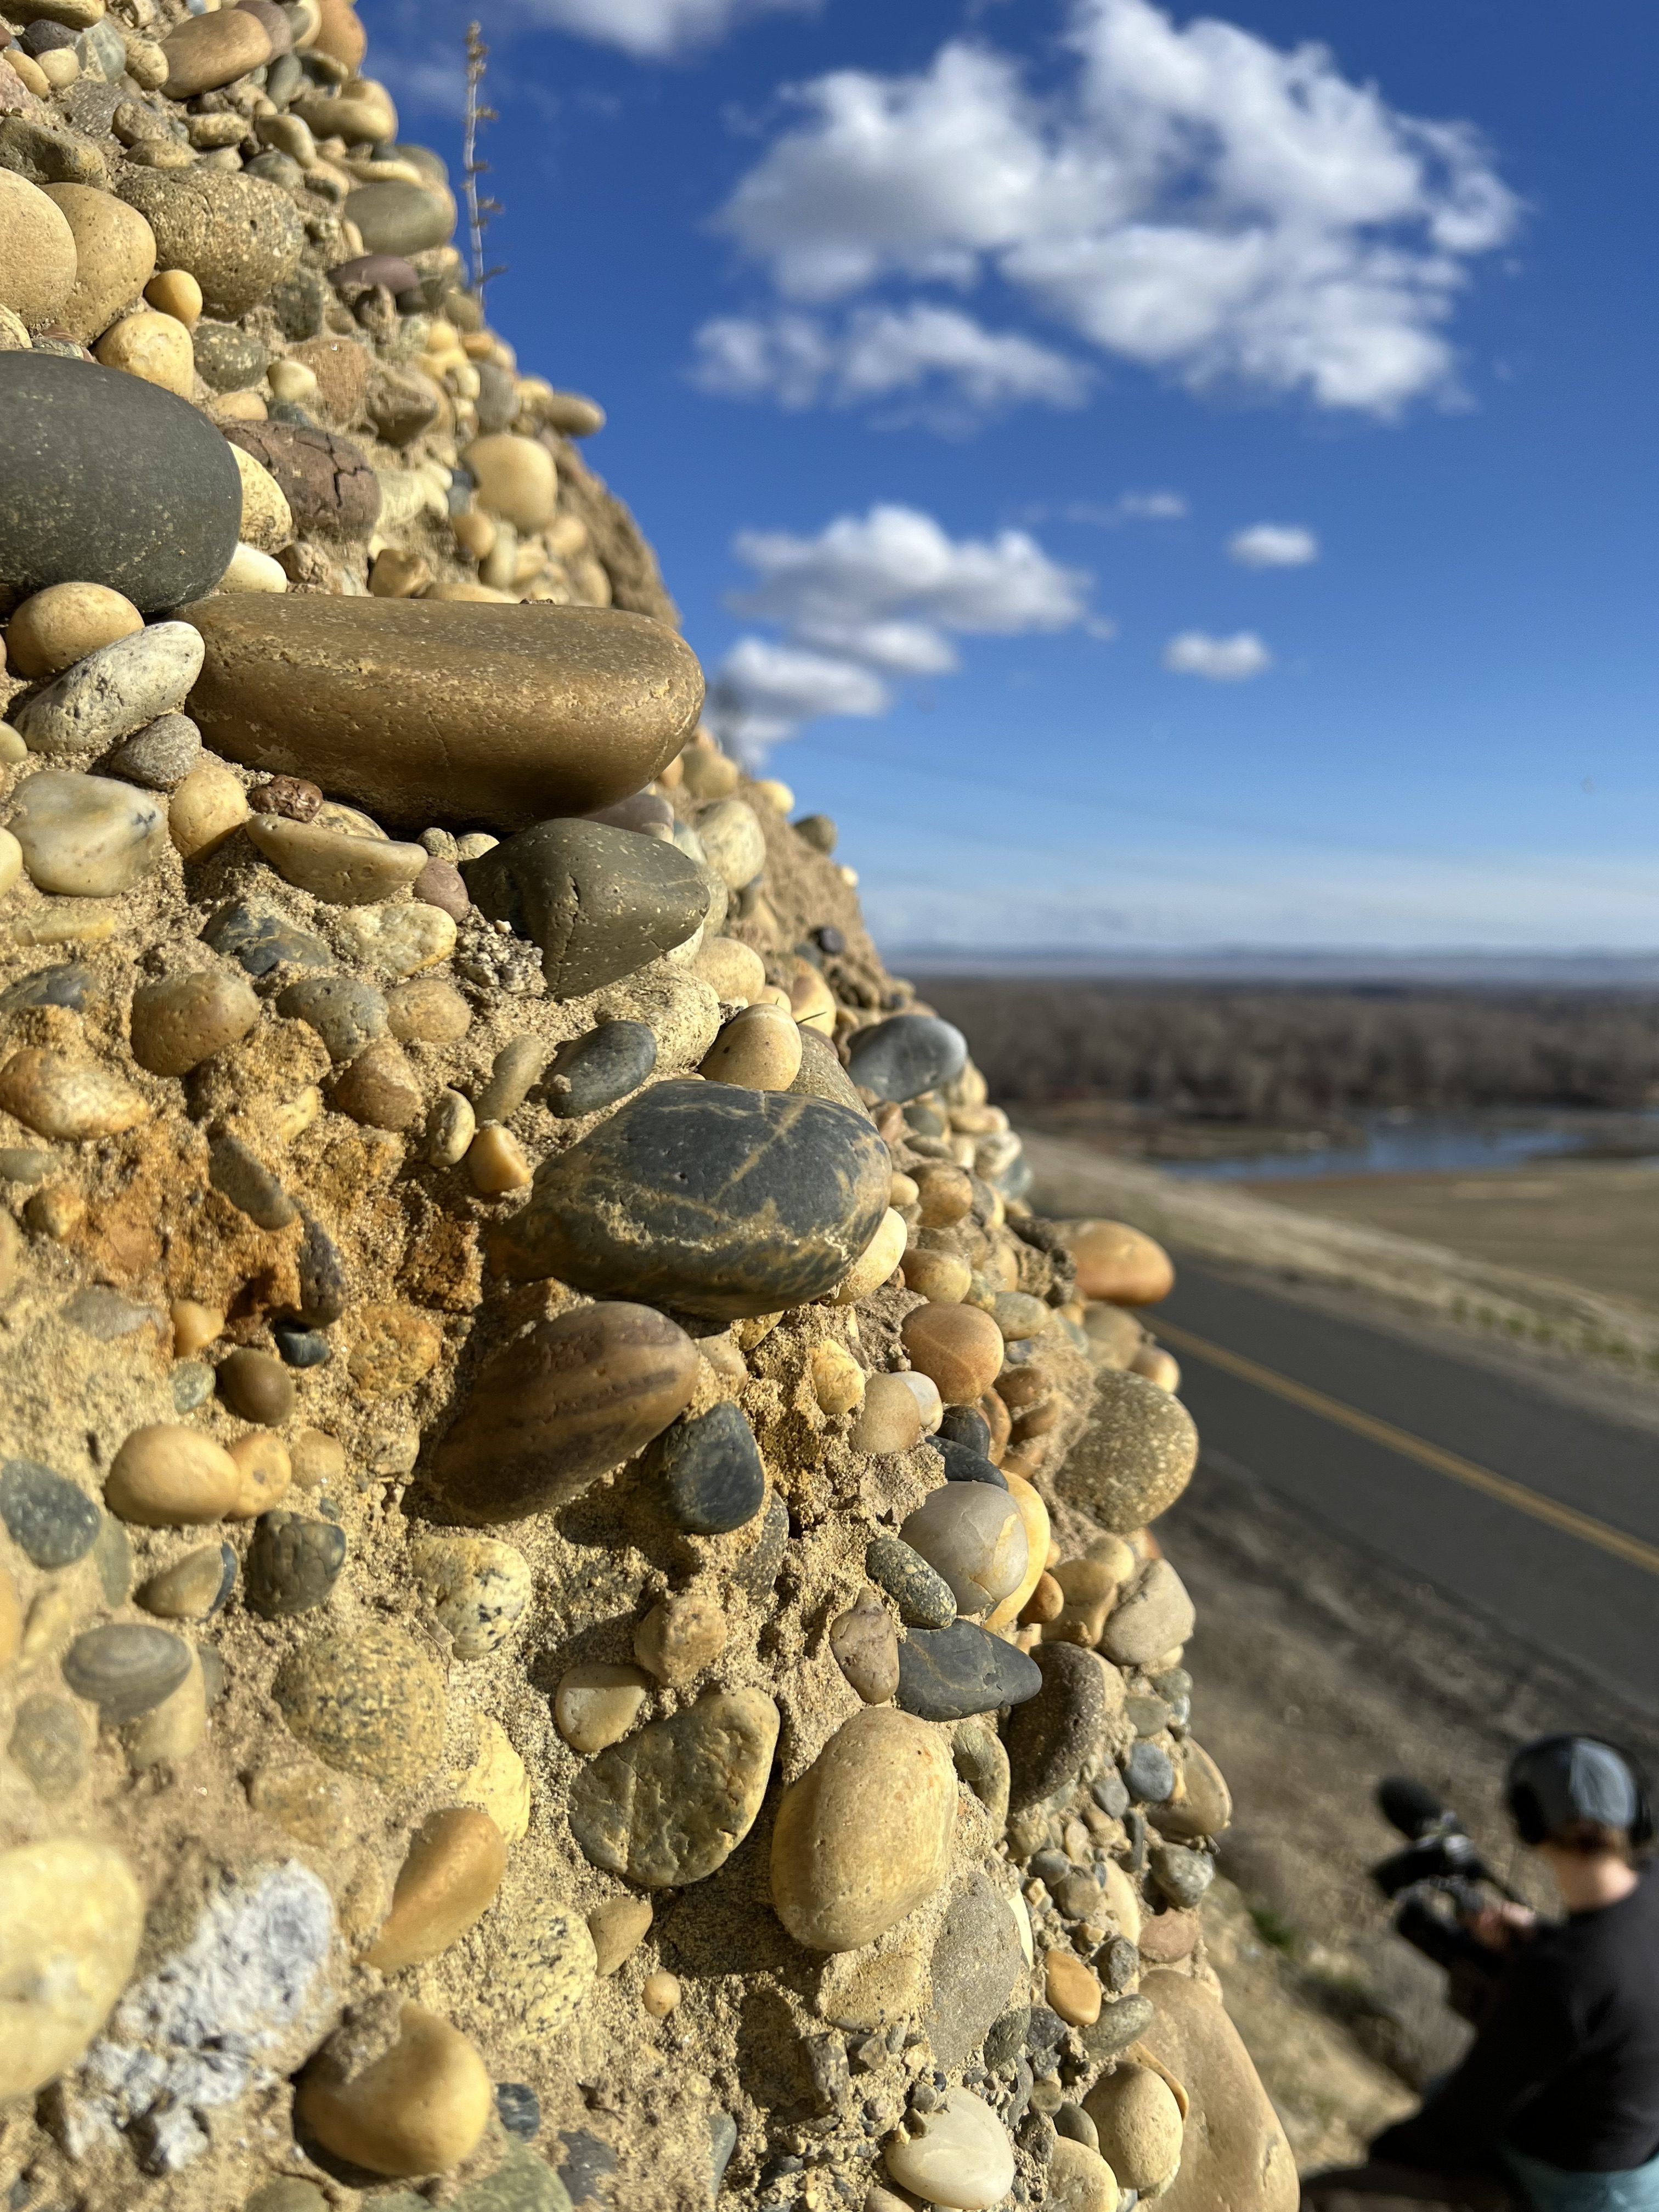
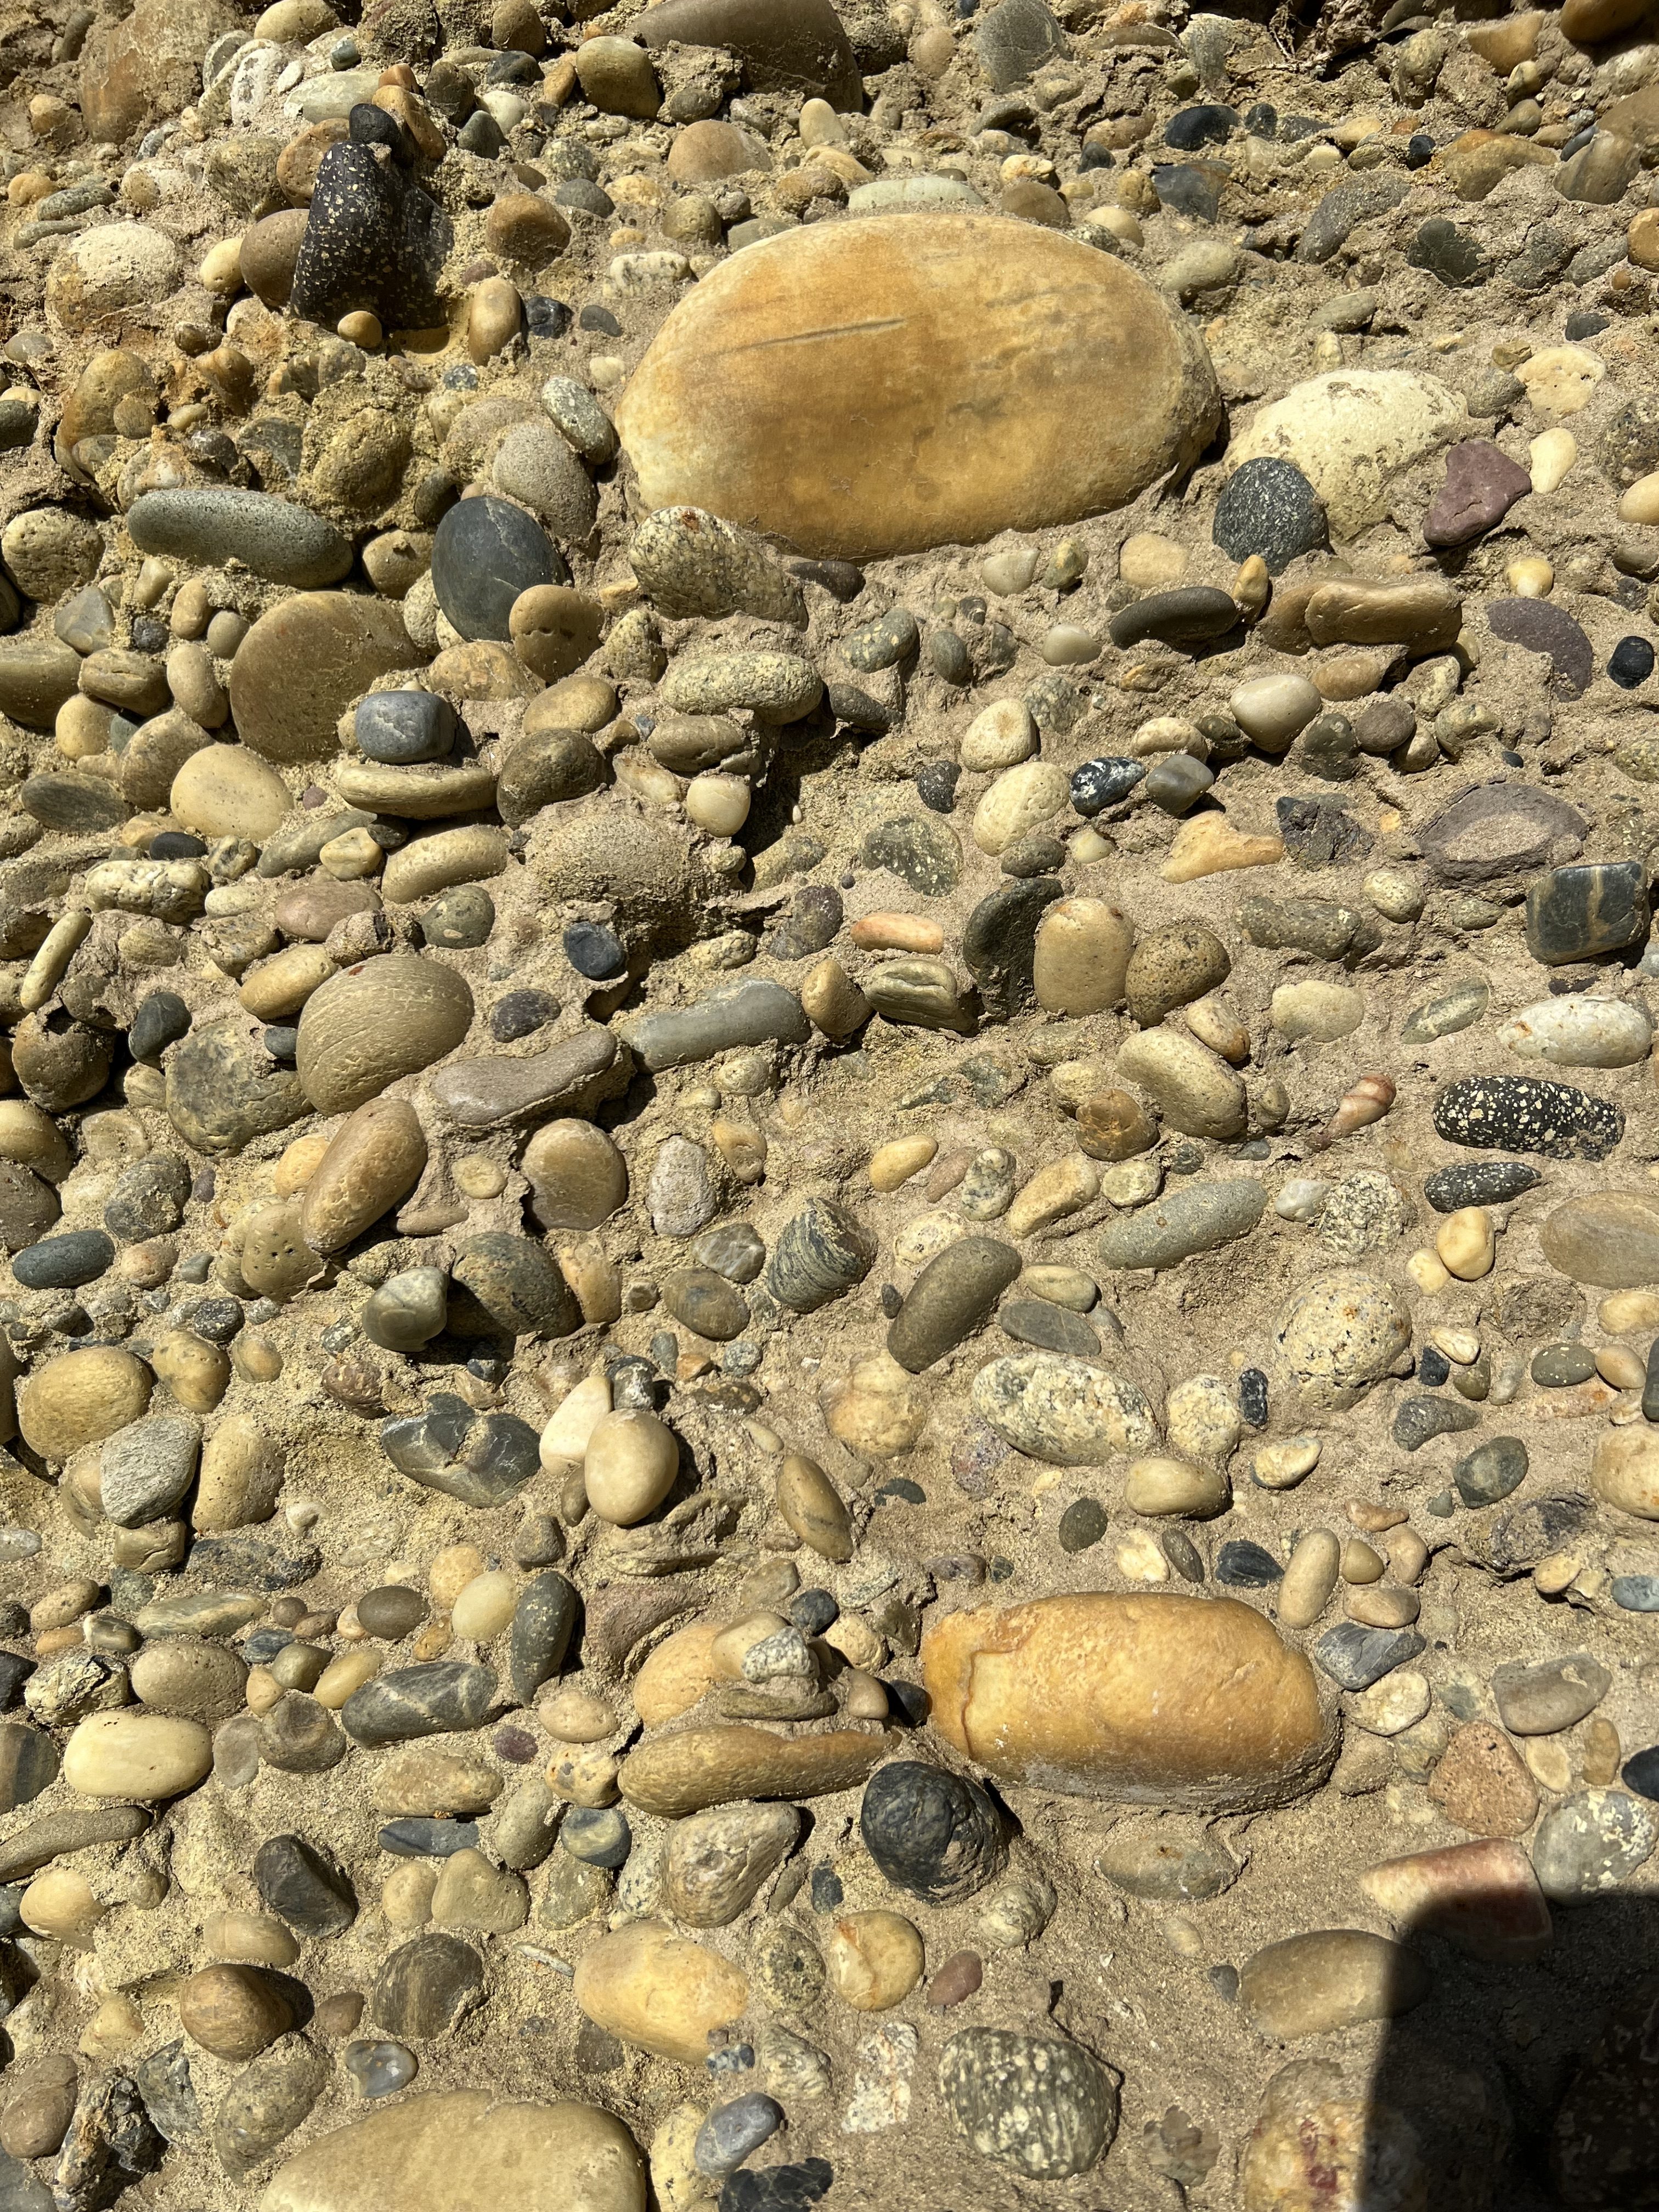
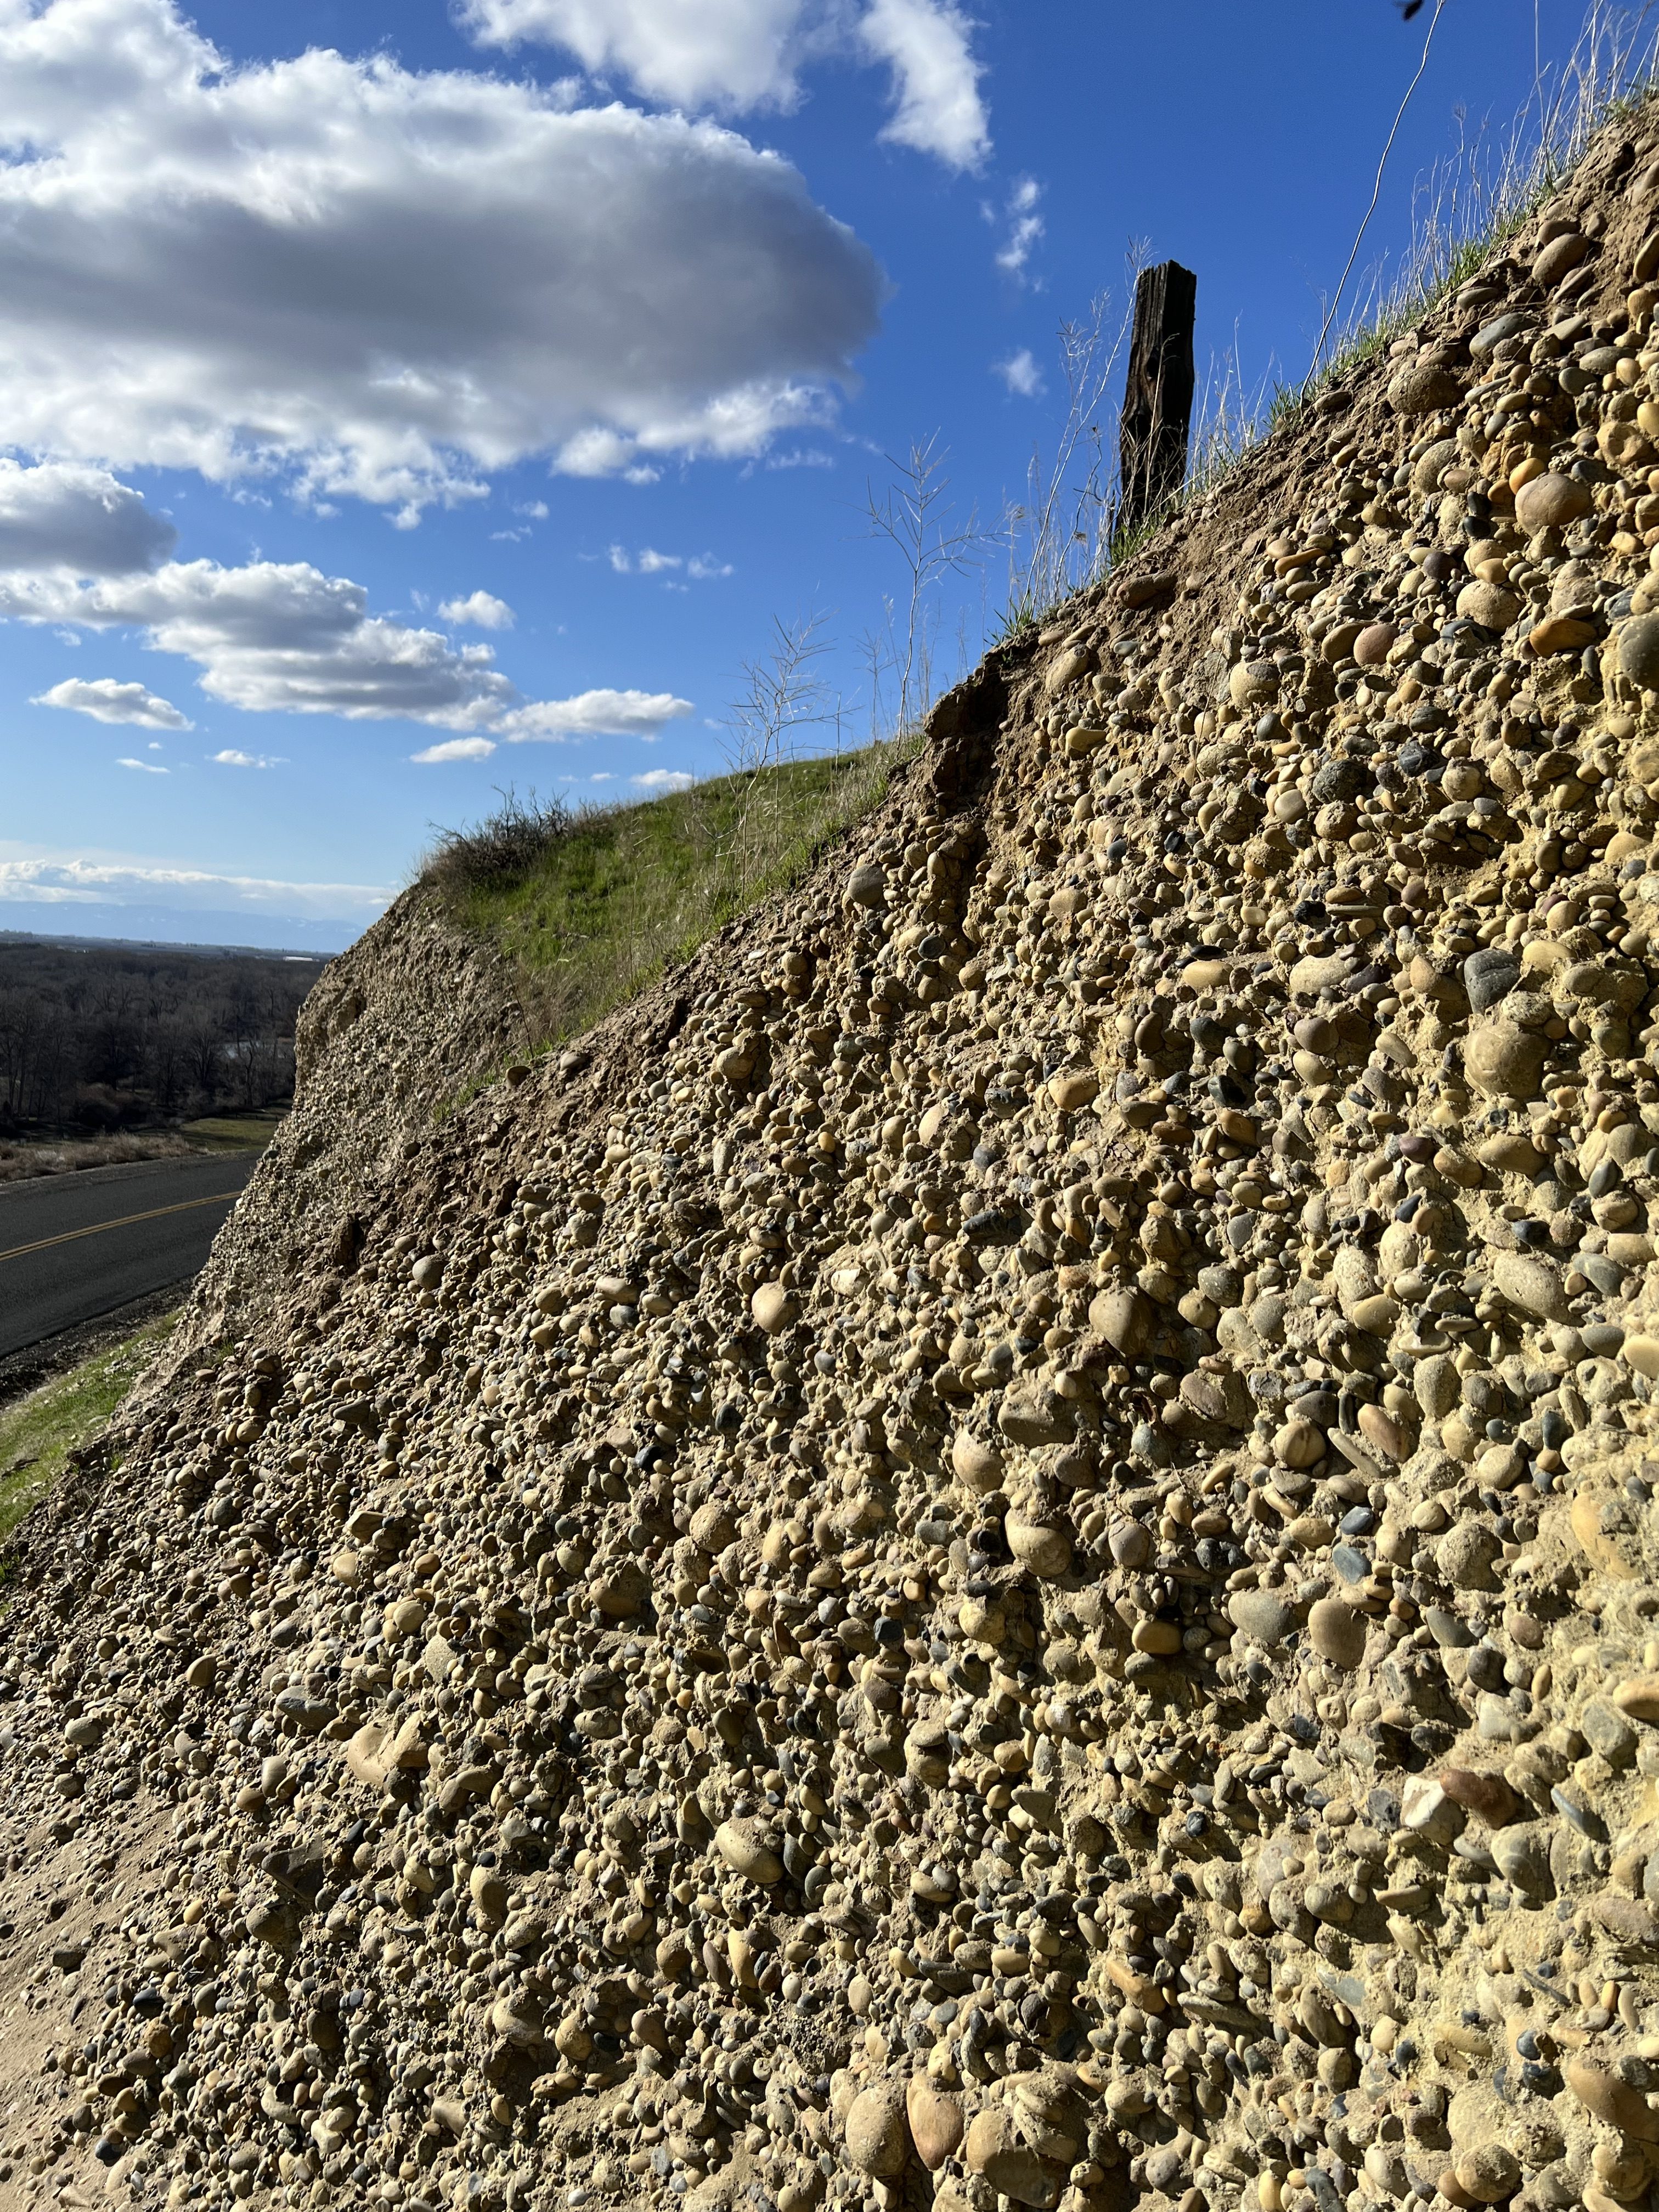
After the interview, Nick showed Seattle Times’ reporters how to “read the rocks” in a roadside cut near Granger, Washington. Ten-million-year-old blond quartzite river cobbles, resembling potatoes, were stacked several stories high, evidence that the powerful, ancient Columbia River once flowed here (it is now some 15 miles away). The cobbles themselves are like a work of art.
Nick Zentner, geology professor at Central Washington University, describes the geology of the Columbia River Basin at a roadside cut near Granger, Washington. Photo by Fiona Martin.Close-up of 10-million-year-old river cobbles transported by the ancient Columbia River. Today, the Columbia River is about 15 miles away from this site. (The Yakima River is visible in the background.) Photo by Fiona Martin.Another close-up of ancient river cobbles embedded in the roadside cut. Photo by Fiona Martin.The river cobbles are stacked 10–20 feet high in some locations. Photo by Fiona Martin.
Once you know what to look for, you can read the history of Washington. Fiona sought to convey this concept through illustrative storytelling. While Nick talked about geology, she was busy sketching, and gathering as many visual notes as she could.
“While field sketching, I observe on a deeper level. I notice more than I would passing by, because I’m forced to capture the basic shapes, proportions, light and shadow. I take notes on colors, textures, proportions, and patterns. I think about how I might build the final layout. Accuracy is less of a concern—field sketching is more about capturing the moment.” —Fiona Martin
In this ink sketch of a roadside cut, Fiona designed and stylized quite a bit—the real scene was incredibly detailed and large. The resulting sketch shows only the most important elements needed to tell the story. Later in her studio, Fiona created a color version that served as the backdrop for several illustrations.
Here’s a peek at more of Fiona’s original sketches and storyboarding, which helped to organize the scrolling, visual story:
Some ideas didn’t make the cut in peer reviews. Fiona planned to end the scroller with a “toast” to the ice age floods, which brought the fine silty soil that supports 90% of Washington’s wineries. But alcohol can be a sensitive subject, and Seattle Times wanted this presentation to be a resource for teachers and students.
Next, Fiona created more detailed preliminary sketches, paying attention to proportions and accuracy. The illustration below describes some of the ecological costs of hydropower damming. Walleye (Sander vitreus) are an invasive, predatory fish with an appetite for juvenile salmon, and they love the warm slackwater reservoirs behind the dams. It would have been difficult to photograph a walleye eating salmon, so Fiona saw a good opportunity to add an illustration.
For the color rendering, Fiona used Procreate on an iPad Pro tablet with an Apple pencil. Her digital painting method captures the expressiveness of traditional acrylic or oil painting, while retaining editable layers for production needs. On the iPad, she prefers a screen protector that has a paper texture. Using only a few brushes, she starts with midtones first, then adds shadows, highlights, and textures. Fiona’s favorite part of the process is seeing the sketches “come to life.”
The walleye illustration was featured in the mainbar (read more about this invasive fish and the efforts of the Nez Perce tribe to save salmon in Chapter 4: Unraveling).
Once Fiona finished all of the illustrations and maps, she arranged them the scrolling story, “Born of Fire and Ice,” using some custom HTML/CSS. In the scrolling format, readers can follow at their own pace and learn about one concept at a time.
Some of the locator maps were also included in Lauren’s video.
Finally, Fiona drafted a mock print layout for the local section, which was then adopted by the page designers.
A project of this magnitude takes a team, from content experts to copy editors. Special thanks to all the wonderful humans who made this possible:
Lynda Mapes, Environmental Reporter with 40+ years of experience