
Skip to Content

WATER RESERVOIR

View the interactive, scrolling graphic in “WA’s mountain snow recharges our drinking water, powers our lives—now it’s turning to rain,” by Conrad Swanson. Published Sunday, Feb. 4, 2024, in The Seattle Times. This article helped launch the newsroom’s Climate Lab, a group of reporters dedicated to environmental and climate-related stories.

I also created a map of Chester Morse Lake, one of the main reservoirs supplying drinking water to the city of Seattle.

Map of Chester Morse Lake, showing the Cedar River watershed and key landmarks related to Seattle's drinking water.

These charts shows how water levels fluctuate within each year, revealing where there were anomalies or record lows.

Chart showing the water surface elevation above sea level in Seattle's Chester Morse reservoir from January 2023 to January 2024, highlighting seasonal fluctuations and key positions related to flood management.
Chart showing the fluctuations of water levels in Chester Morse Lake over the years, indicating the second lowest level recorded in November 2023.

Process

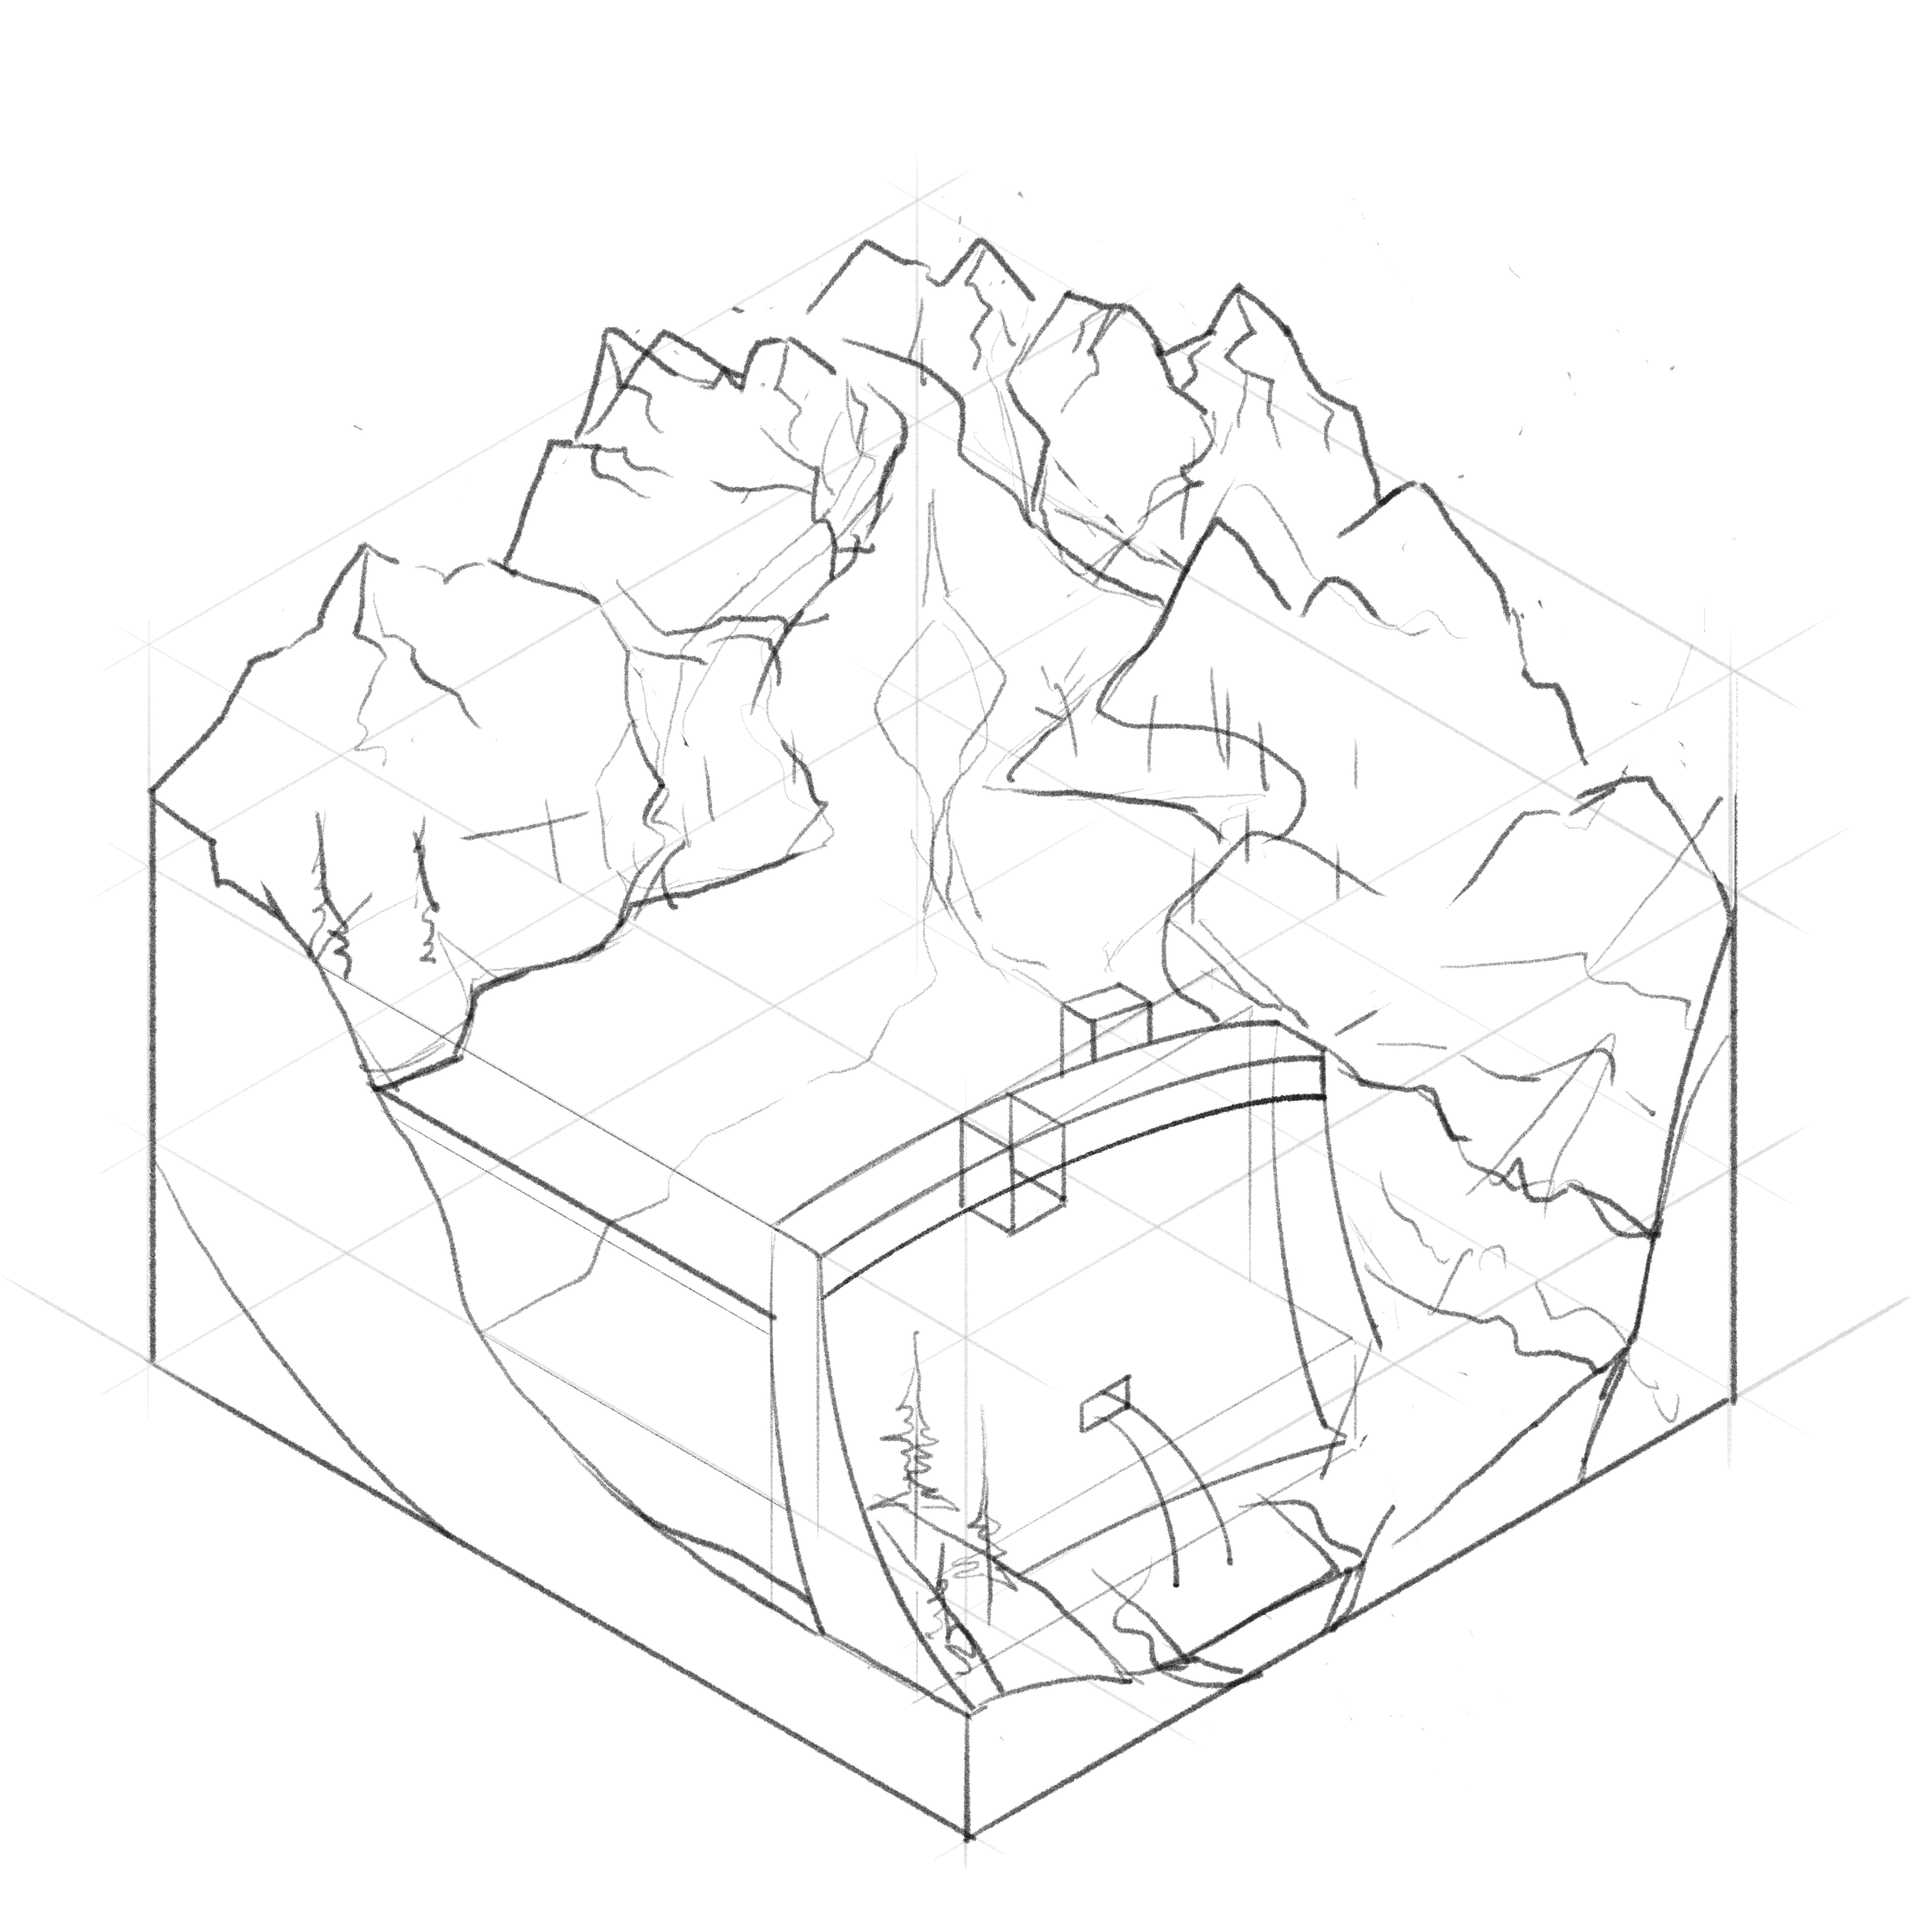
Here’s some of my preliminary sketches. I rendered the color drafts in Procreate using a pencil-like brush for the linework and watercolor fills. Finally, I created the simple animation (above) in Adobe After Effects.
Featured

LONGVIEW PULP MILL DISASTER
FUSION ENERGY
Helion's fusion might power Microsoft data centers
FUSION ENERGY
PINK SALMON BOOM
PINK SALMON BOOM
ICE ARRESTS BY SEATTLE FIELD OFFICE
Multi-chart graphic showing that several northwest counties and municipalities saw a sharp increase in ICE arrests following the start of President Trump's second term, including King, Clark, Whatcom, and Yakima Counties in Washington; Multnomah, Marion, and Washington Counties in Oregon, and Anchorage municipality.
ICE ARRESTS BY SEATTLE FIELD OFFICE