VISUALIZING THE FENTANYL CRISIS
As fentanyl overdoses became an increasingly urgent public-health crisis in Washington, I created a series of explanatory illustrations and data visualizations for The Seattle Times to help readers understand the scale of the crisis, how to recognize an opioid overdose, and how to provide potentially lifesaving care.
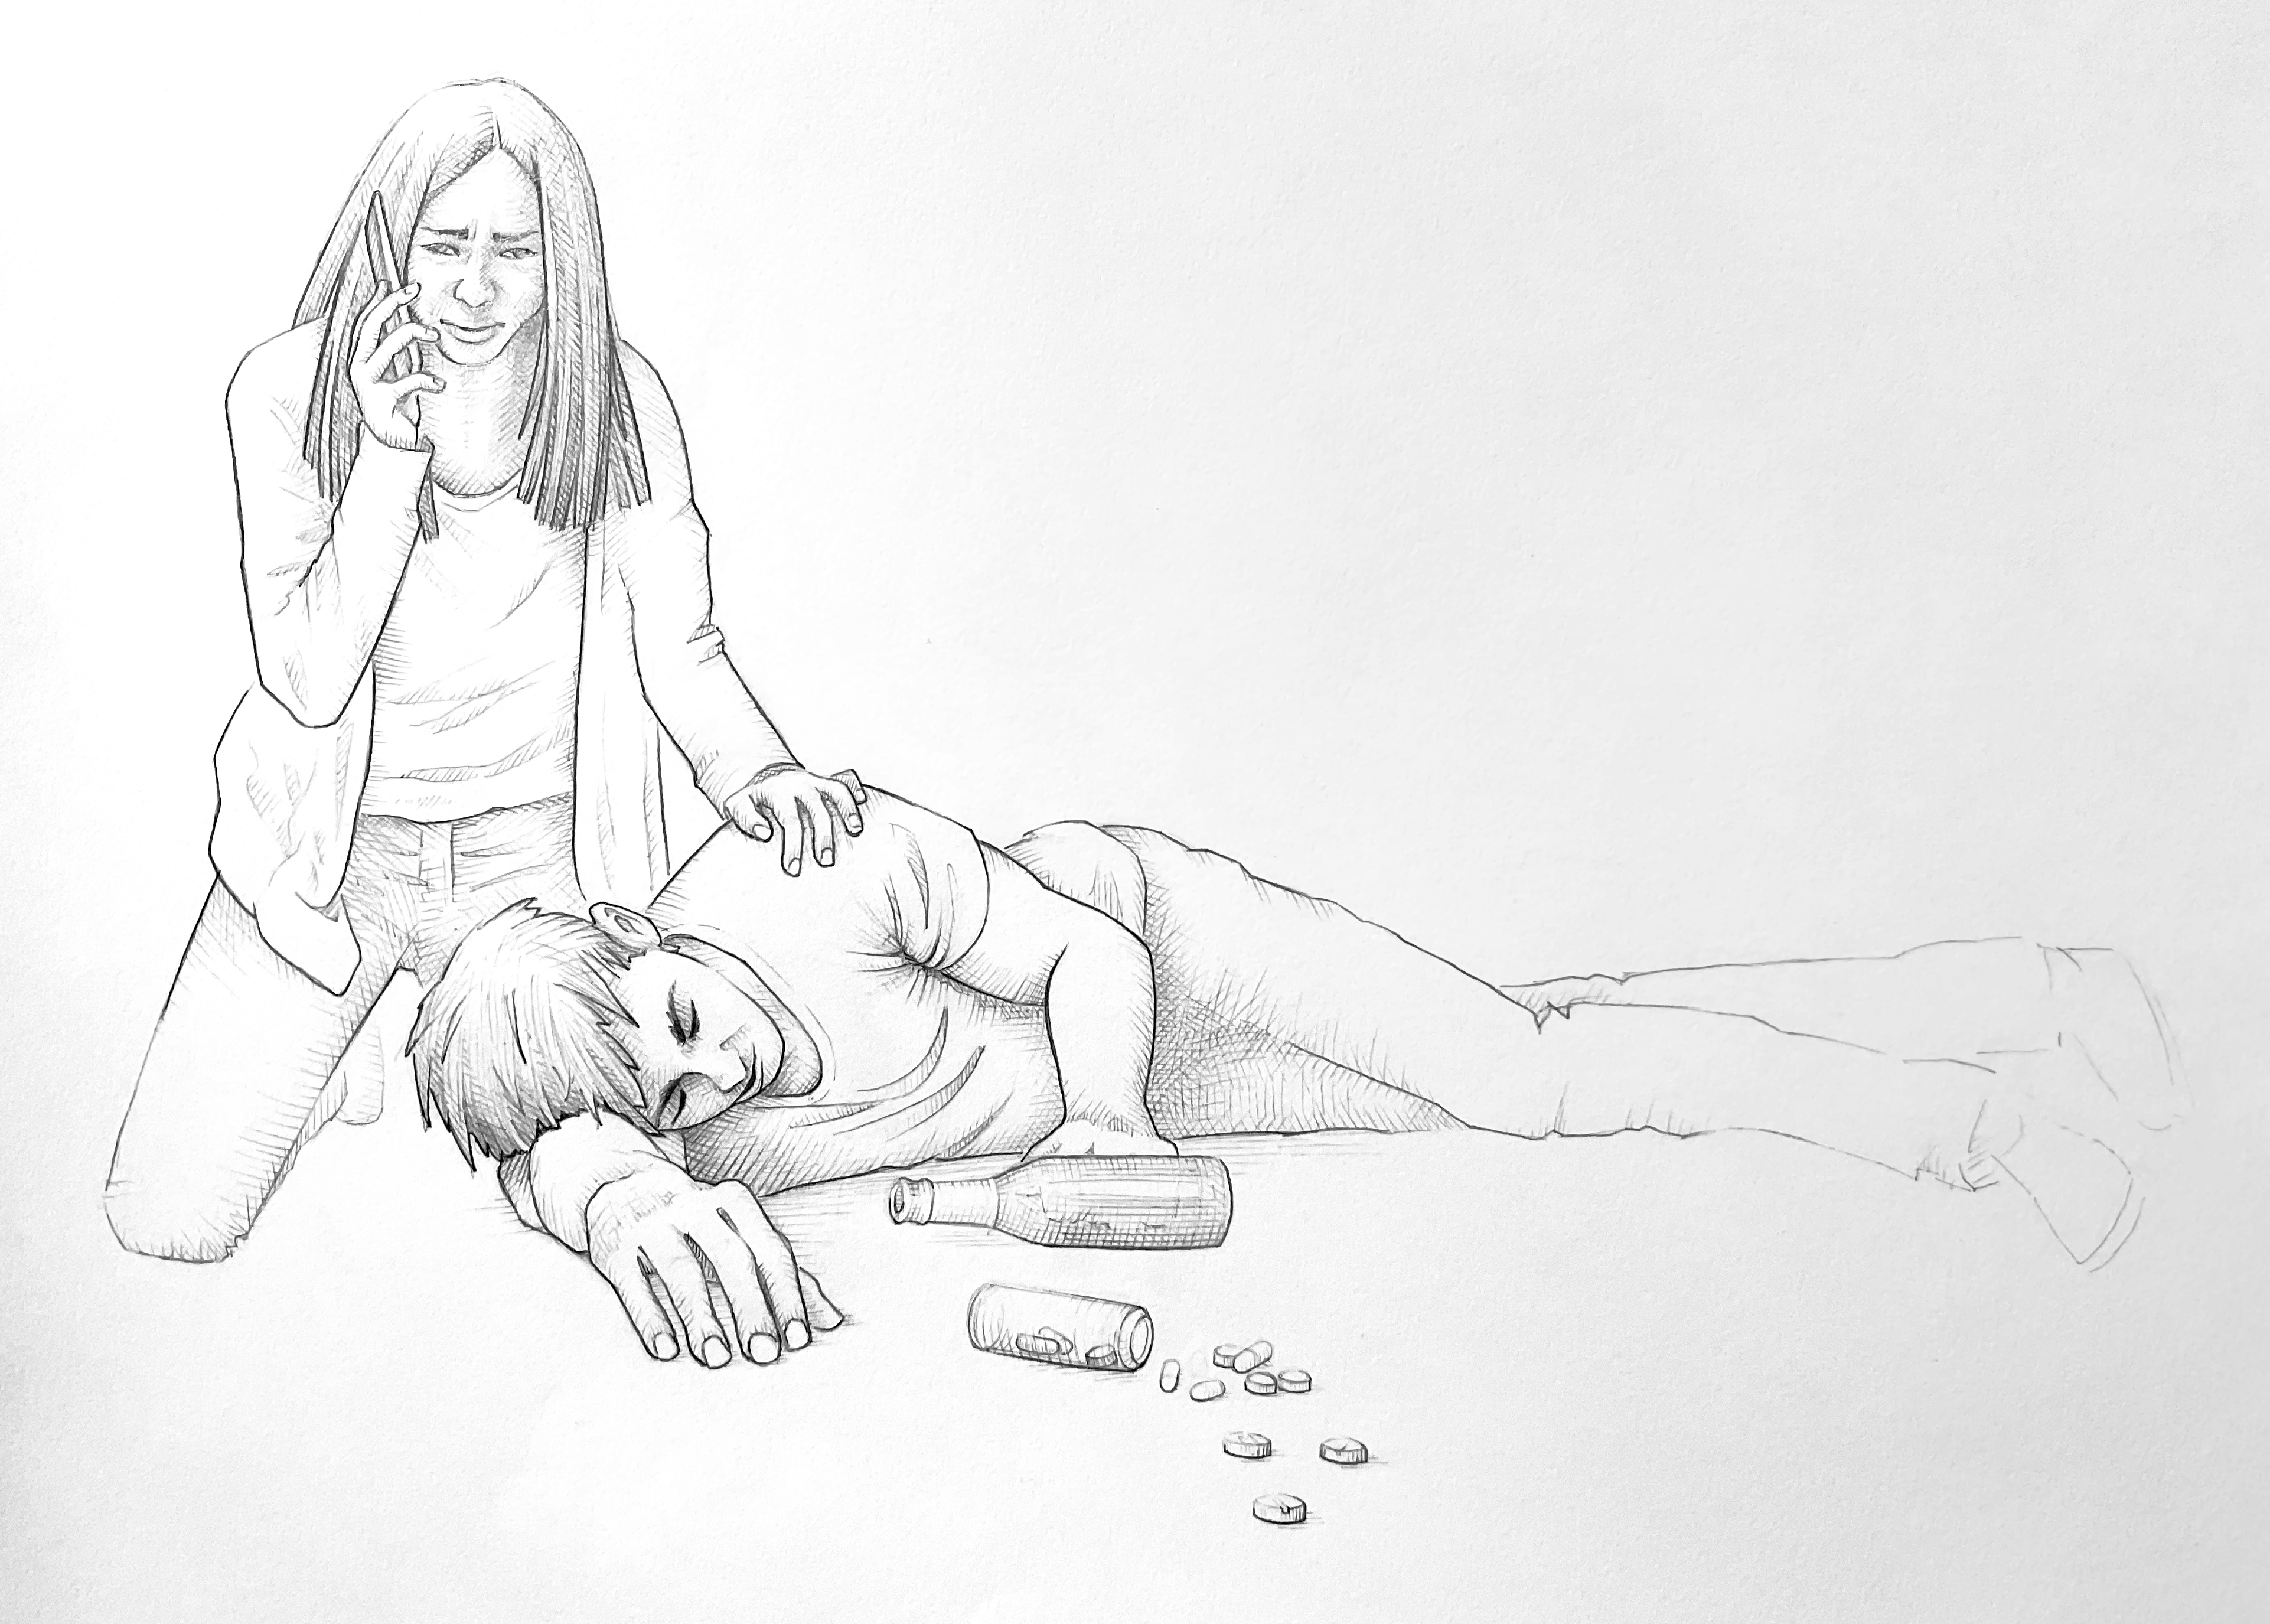
For a feature image, I created a detailed illustration of a woman responding to an overdose victim. I began with a traditional pencil sketch and hatched shading, then added color digitally in Procreate. The human-centered approach adds emotional weight to the reporting, while labels identify common signs of an opioid overdose and provide additional context. I also created a step-by-step guide to administering nasal-spray naloxone, commonly known by the brand name Narcan. Here, simplified black-and-white vector illustrations serve a different purpose: they are quick to interpret and accessible as a separate graphic on mobile devices. The guide explains how to recognize an overdose, administer naloxone, determine when another dose may be needed and provide care until paramedics arrive.
Using both approaches allowed me to match the illustration style to the editorial and production needs: detailed, expressive artwork for a prominent feature image and streamlined vector graphics where immediacy, clarity and accessibility were important.

Another more scientific illustration answers a more fundamental question: How does naloxone work? I created a simplified view of receptors in a cell membrane to show how naloxone binds to these receptors and displaces opioids, temporarily blocking their effects. The goal was to turn an invisible mechanism into an easy-to-understand diagram.

Showing the crisis through data
Alongside the illustrations, I created a series of interactive charts and data visualizations tracking fentanyl overdose deaths in Seattle, King County and Washington. These graphics show how overdose deaths changed over time, disproportionate impacts, more recently, signs of a decline in deaths. Hover or tap to show additional data.
Together, this body of work uses data visualization, scientific illustration and instructional design to explain the same public-health issue at different scales—from population-level trends, to how naloxone works at a cellular level, to the actions one person can take during an overdose. Each format serves a different purpose, but the goal is consistent: turn complex and potentially life-saving information into visual journalism that is accurate, approachable and useful.
Published stories:
WA sees largest drop in overdose deaths in a decade
How to spot, respond to a fentanyl overdose
What to know about Narcan, the overdose-reversal drug with FDA approval
How fentanyl became Seattle’s most urgent public health crisis
King County’s 2023 fentanyl deaths top 1,050, surpassing record
Process
The feature illustration combines traditional and digital techniques: pencil and hatched shading on paper, followed by color in Procreate and Photoshop while preserving some of the texture of the original drawing. I created the instructional and scientific illustrations in Adobe Illustrator, drawing on my previous experience as Senior Illustration Editor of the Annual Review of Cell and Developmental Biology. Interactive charts were built in Datawrapper and adapted in Illustrator for print.