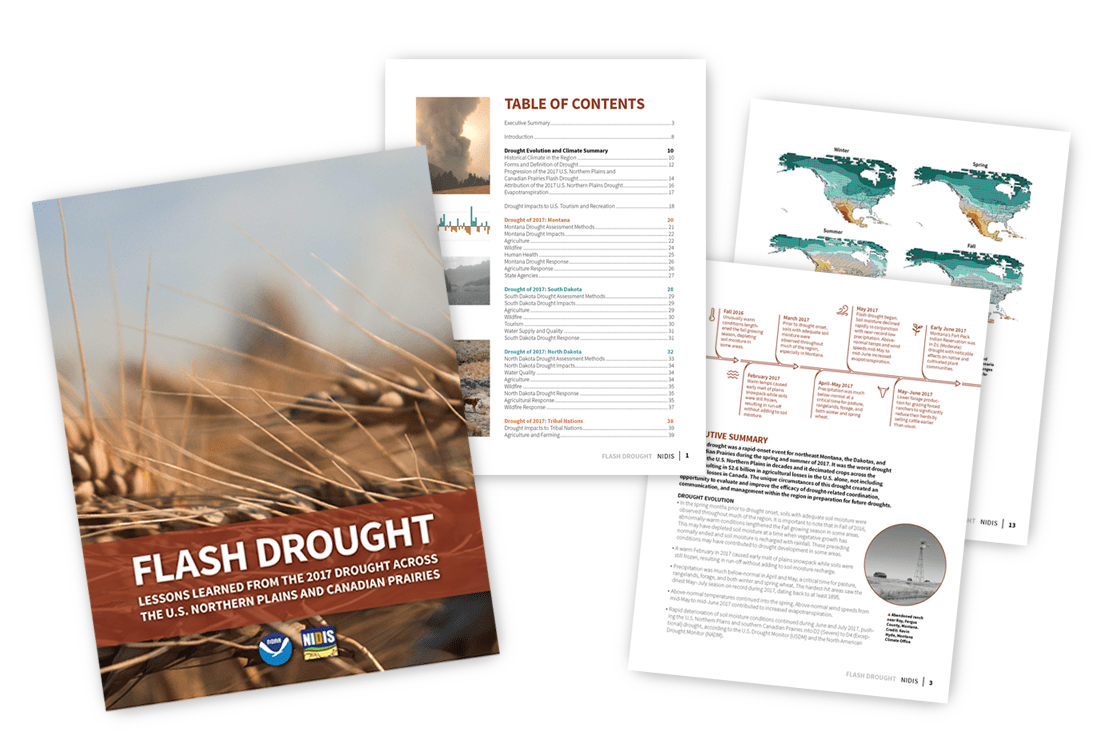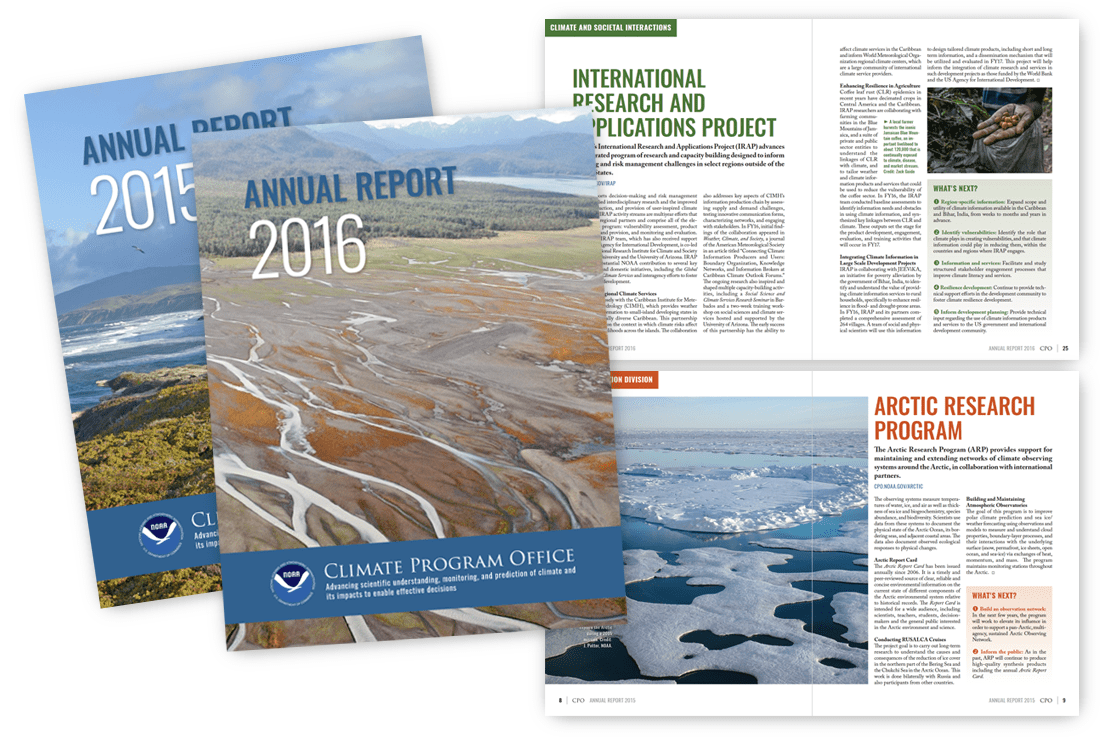
NOAA & NIDIS CLIMATE REPORTS
From 2014 to 2024, I contracted with NOAA’s Climate Program Office, translating complex climate and environmental data into accessible charts, maps, illustrations, and visual stories for public audiences, stakeholders, and policymakers.
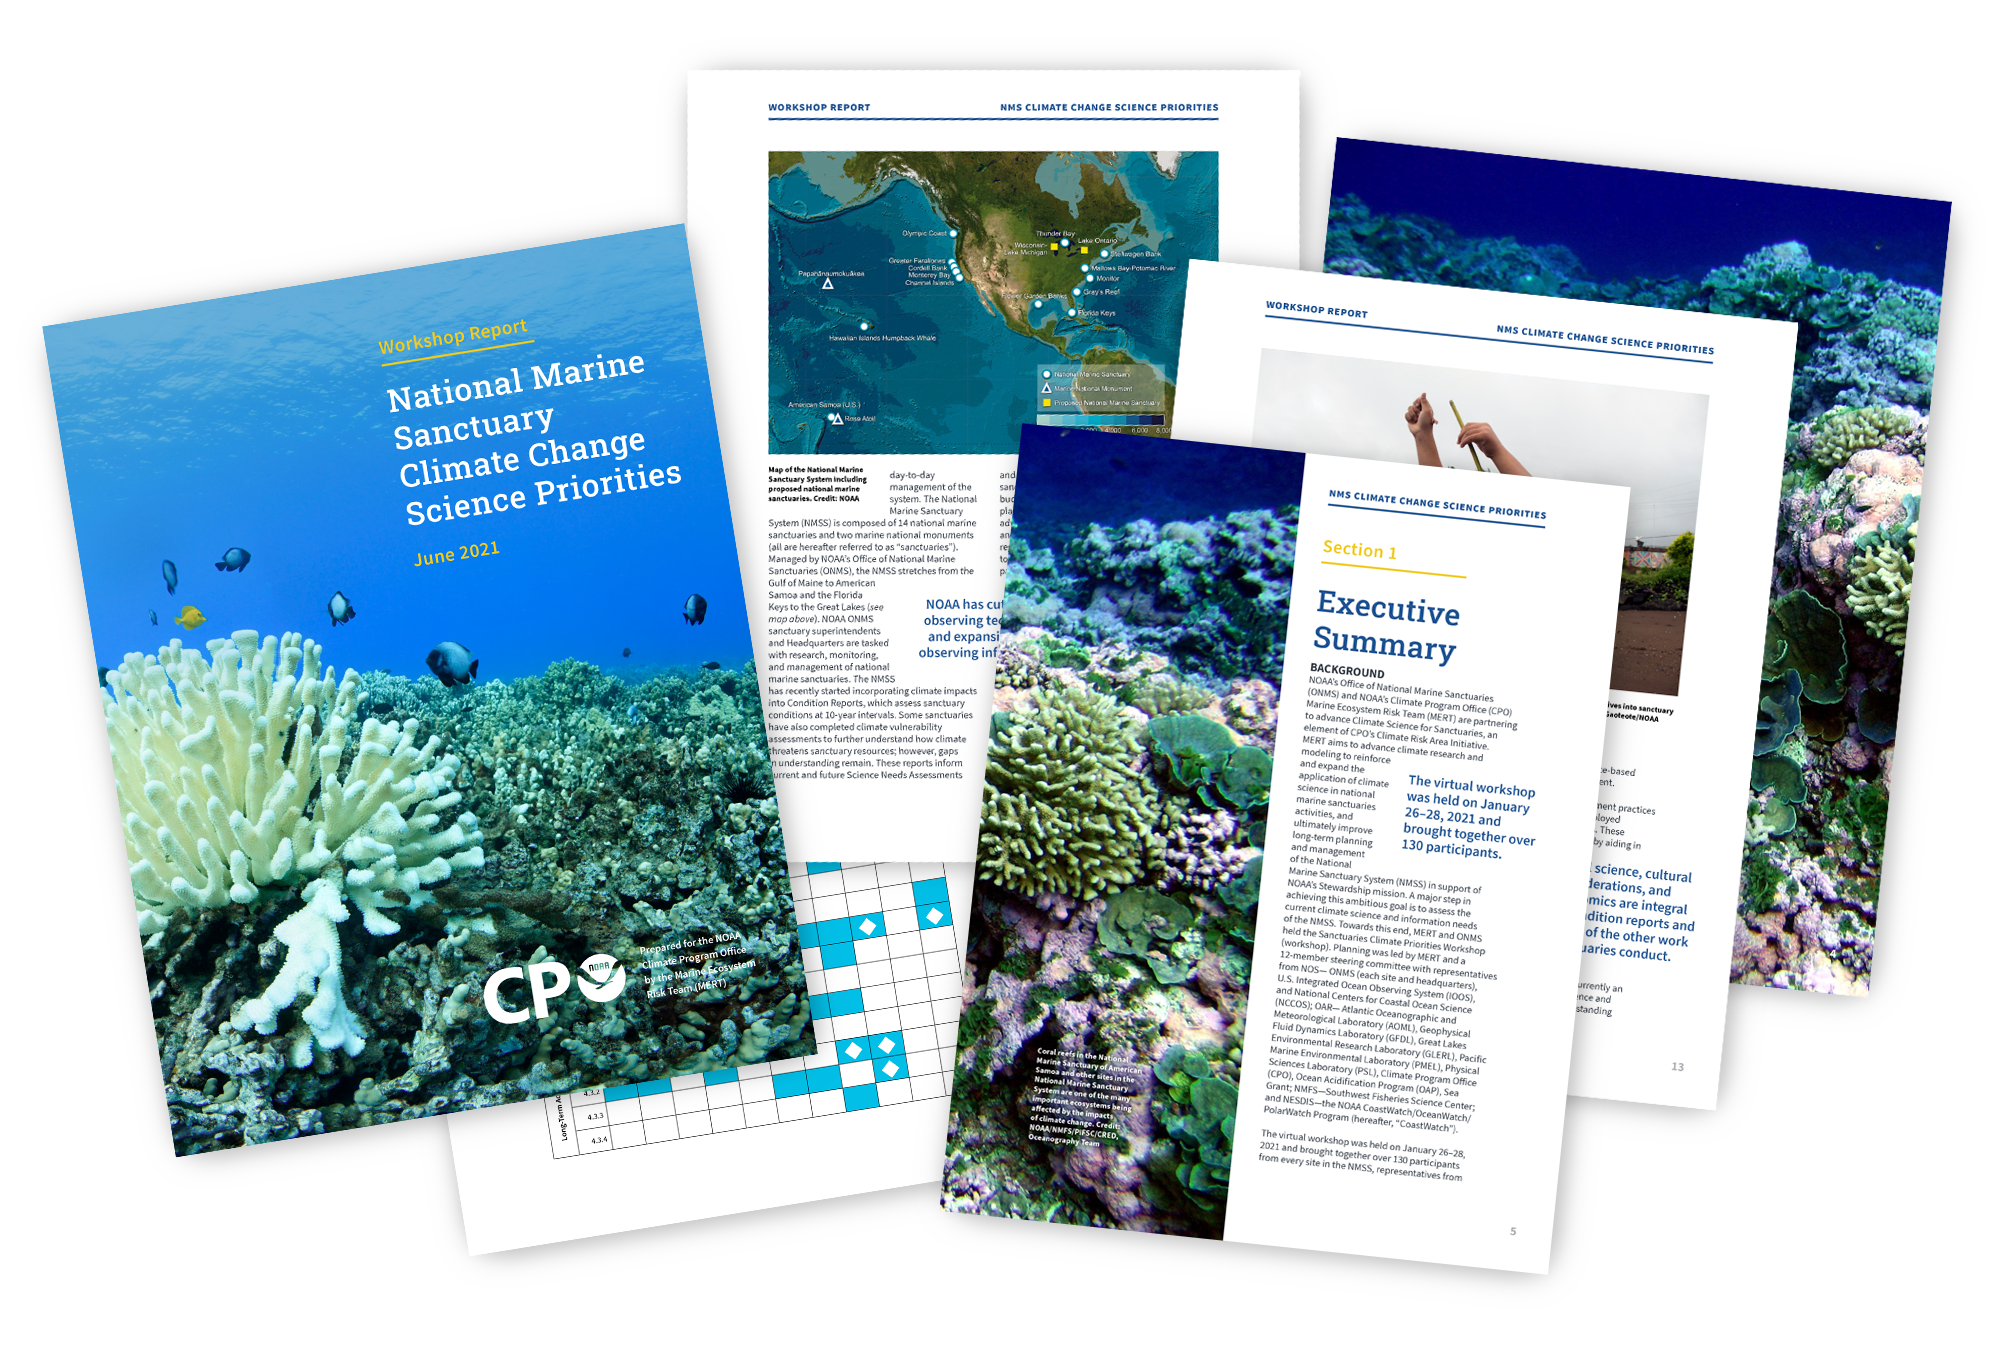
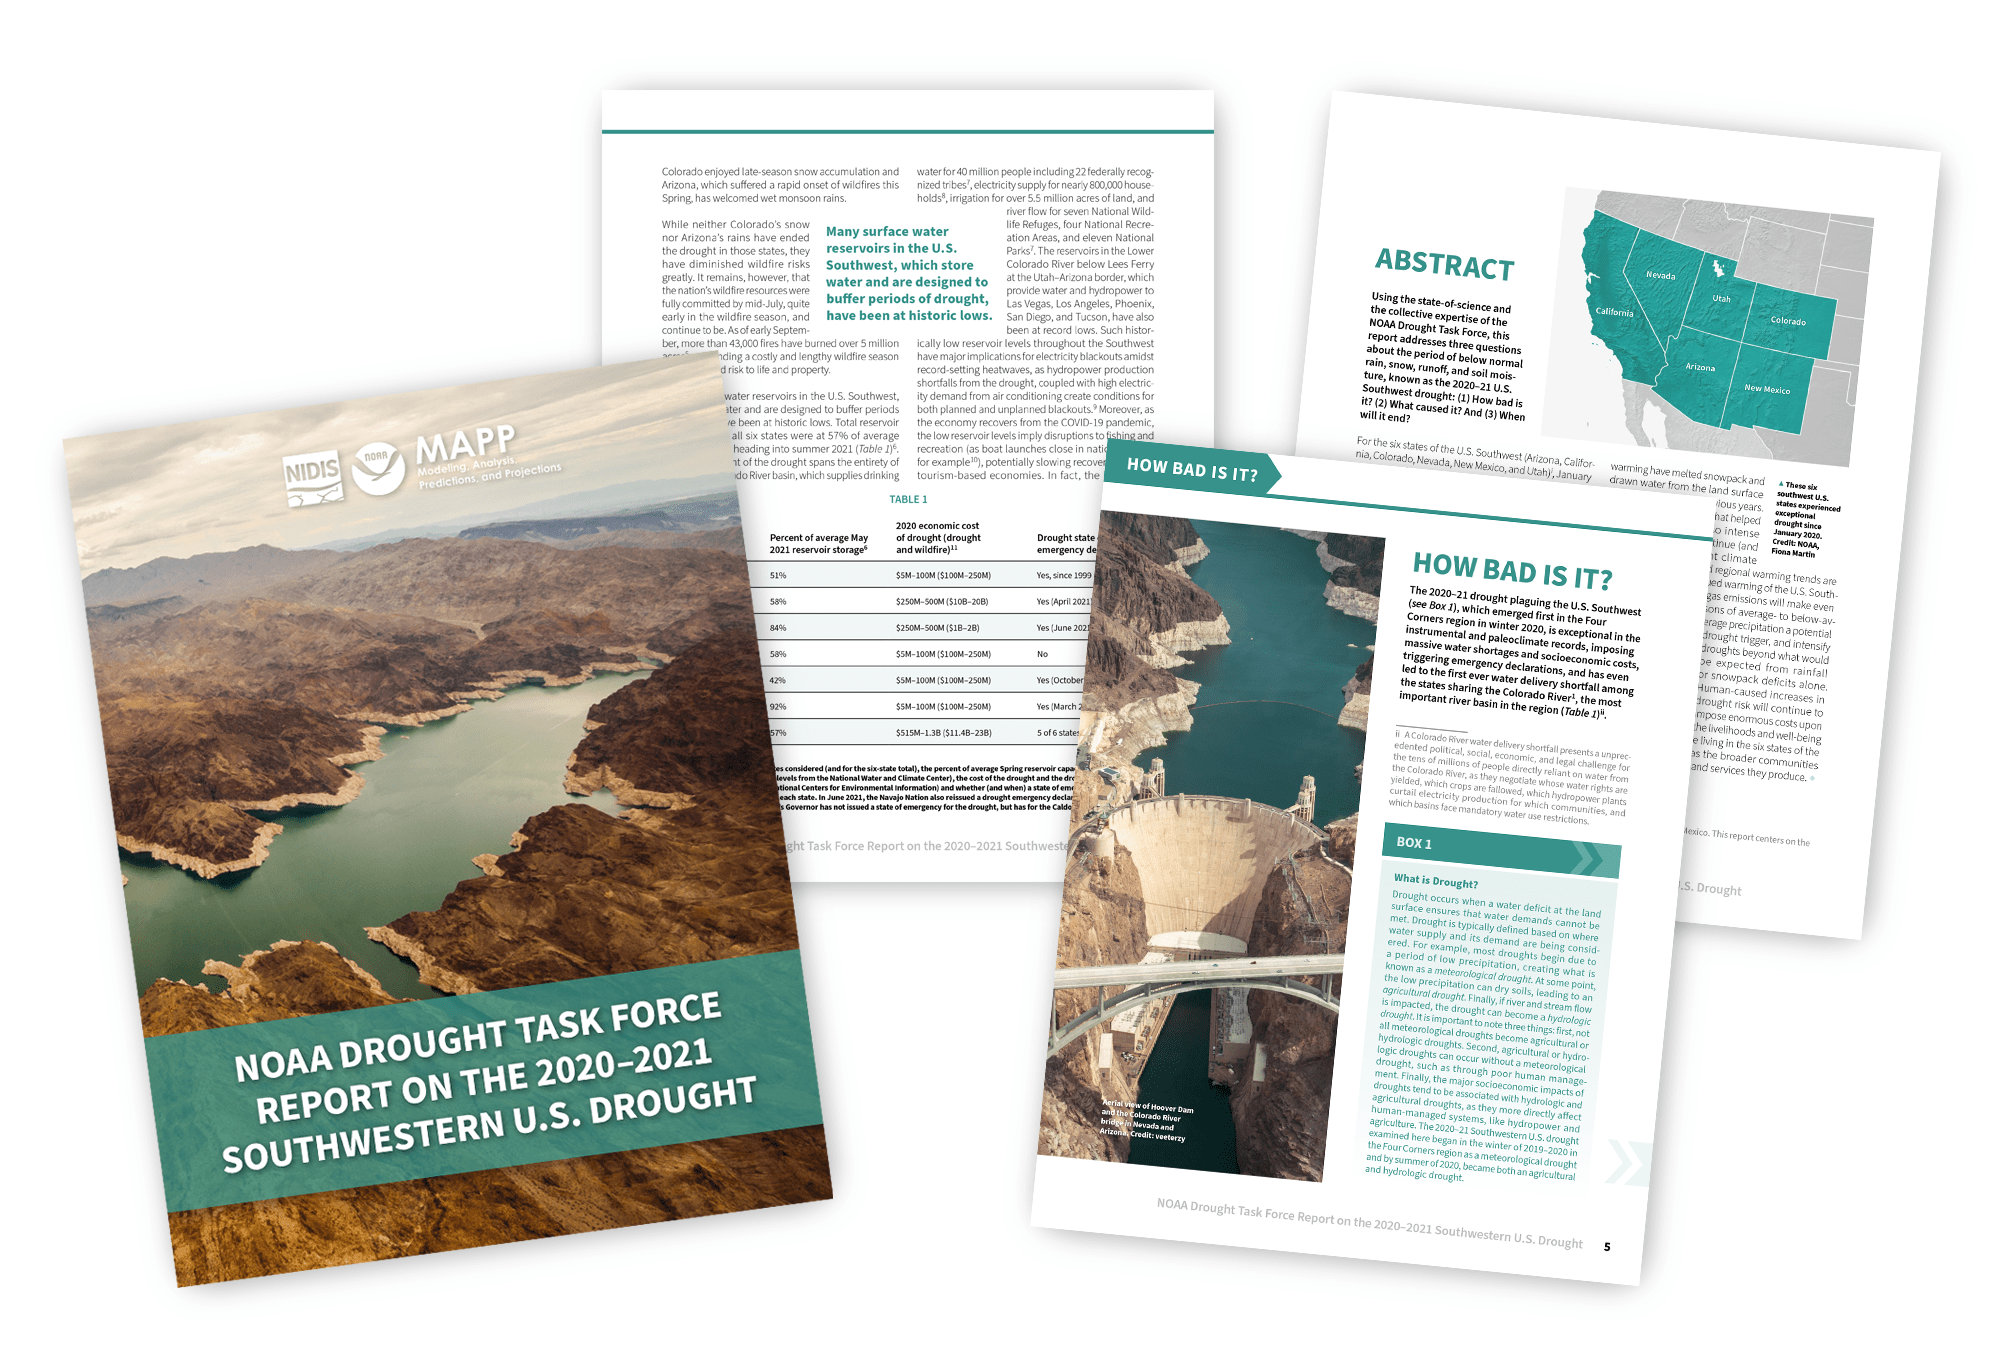
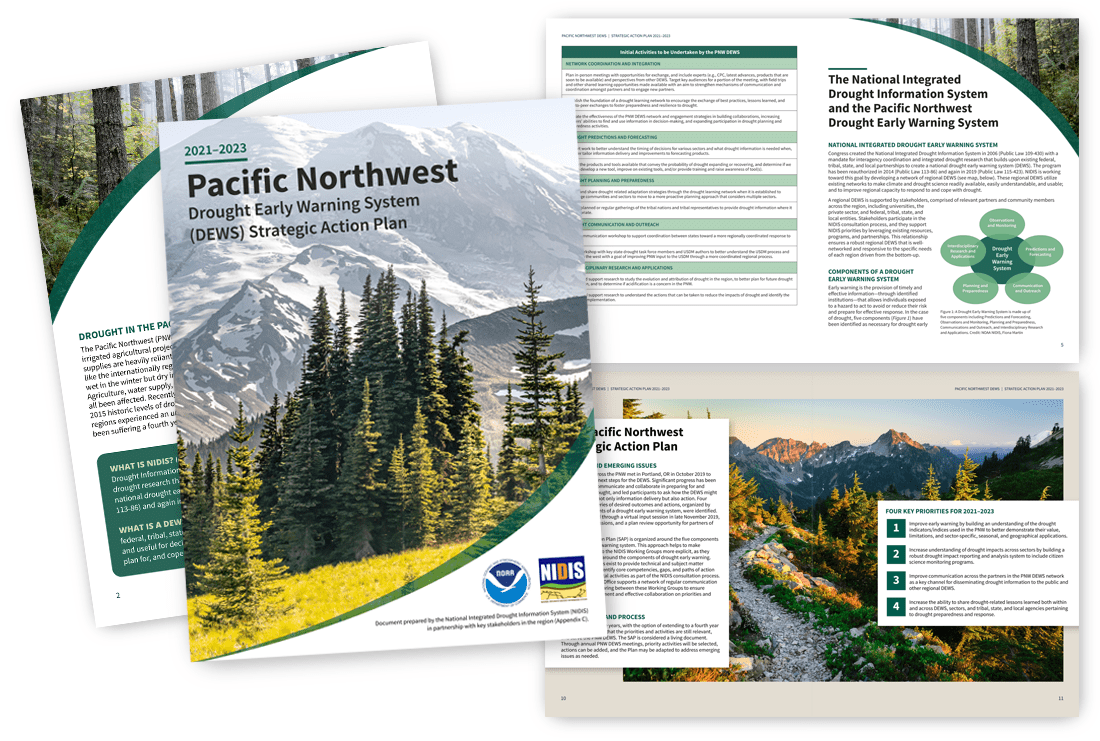
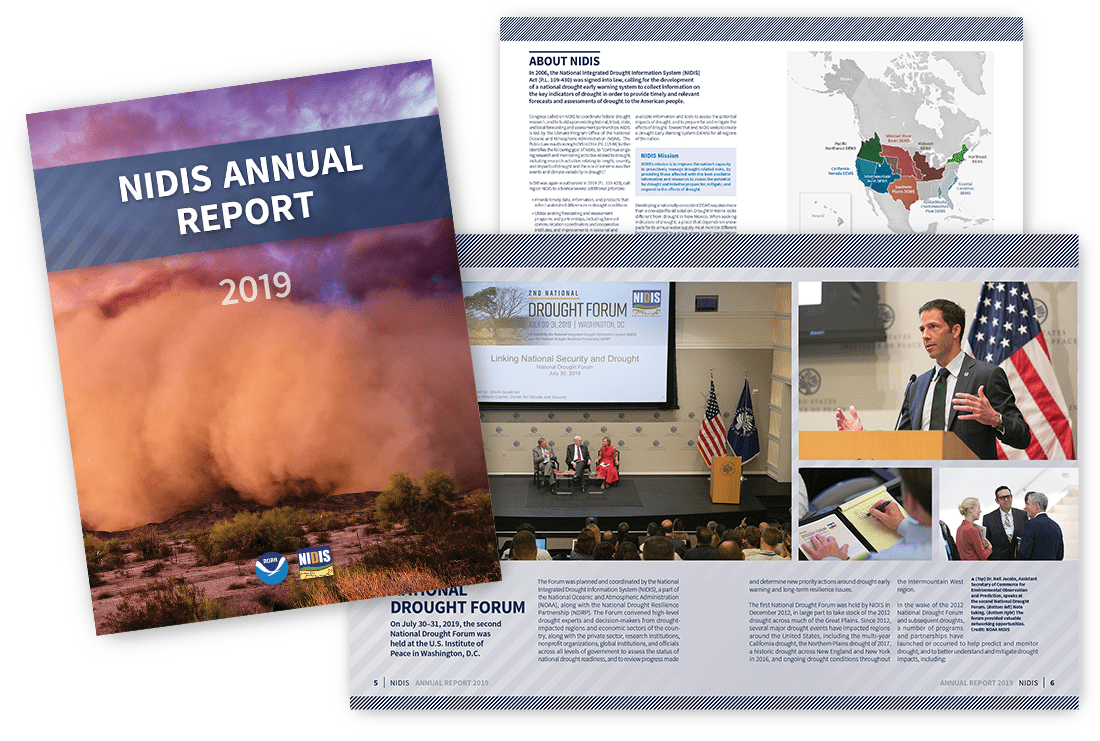
I also led end-to-end design of over 30 NOAA and NIDIS reports, including information architecture, custom graphics, photo editing, layout design, copy editing, and creation of Section 508-compliant interactive PDFs. Throughout each project, I collaborated with writers, editors, scientists, GIS specialists, data analysts, and government stakeholders to communicate complex climate science clearly and accurately.
My latest project was NOAA CPO’s 2024–2028 Strategic Plan.
Below are a few of the earlier reports I designed for NOAA and NIDIS. Note these publications were freely available on Climate.gov and Drought.gov but many were removed during the second Trump administration.
Here are sample pages from other reports commissioned by NOAA / NIDIS. Covers, page designs, photo selections, and graphics are by Fiona Martin / Visualizing Science.